
NZD/USD: the instrument is strengthening
31 January 2019, 09:43
| Scenario | |
|---|---|
| Timeframe | Intraday |
| Recommendation | BUY STOP |
| Entry Point | 0.6930 |
| Take Profit | 0.7000 |
| Stop Loss | 0.6890 |
| Key Levels | 0.6789, 0.6814, 0.6847, 0.6871, 0.6923, 0.6968, 0.7000 |
| Alternative scenario | |
|---|---|
| Recommendation | SELL STOP |
| Entry Point | 0.6865 |
| Take Profit | 0.6789 |
| Stop Loss | 0.6900, 0.6910 |
| Key Levels | 0.6789, 0.6814, 0.6847, 0.6871, 0.6923, 0.6968, 0.7000 |
Current trend
NZD rose against USD on Wednesday, updating local highs of December 11. The reason for the "bullish" dynamics of the instrument was the outcome of the Fed meeting on interest rates.
As expected, the regulator did not change the parameters of monetary policy, keeping the rate unchanged at 2.25–2.50%. The Fed noted strong growth in the employment market and overall economic activity in the country. Inflation may remain at the target level of 2% in the near future.
The day before a new round of trade negotiations between the US and China started. The charges against Huawei, a Chinese corporation, made investors question the outcome of the negotiations and the prospect of a trade deal, but the US officials were quick to reassure the market.
Support and resistance
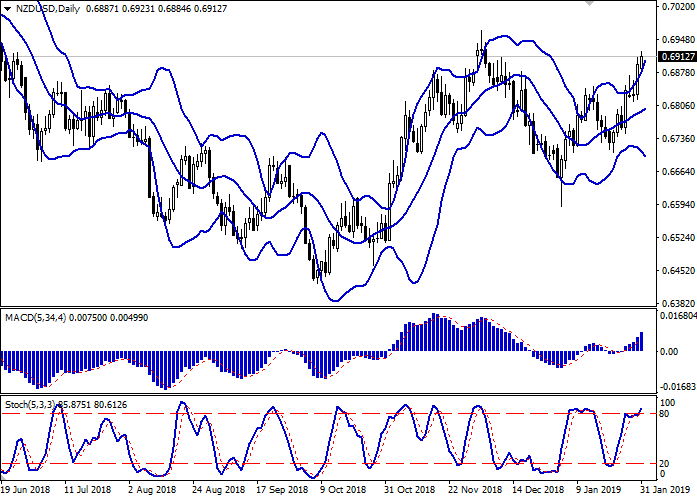
Bollinger Bands in D1 chart show stable growth. The price range is widening but does not conform to the development of the "bullish" trend in the short term currently. MACD indicator is growing, keeping a stable buy signal (located above the signal line). Stochastic keeps its upward direction but is approaching its highs, which points at the risks of overbought instrument in the ultra-short term.
Existing long positions should be kept until the situation clears up.
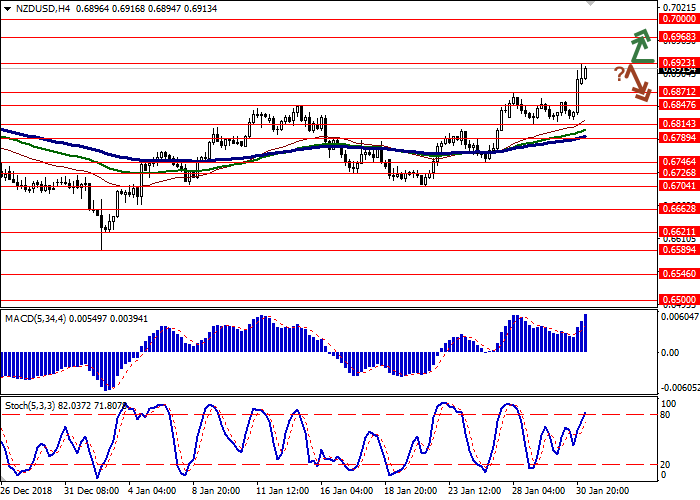
Resistance levels: 0.6923, 0.6968, 0.7000.
Support levels: 0.6871, 0.6847, 0.6814, 0.6789.
Trading tips
To open long positions, one can rely on the breakout of 0.6923. Take profit — 0.7000. Stop loss — 0.6890. Implementation time: 1-2 days.
A rebound from 0.6923 as from resistance followed by a breakdown of 0.6871 may become a signal for corrective sales with the target at 0.6789. Stop loss — 0.6900 or 0.6910. Implementation time: 2-3 days.
NZD rose against USD on Wednesday, updating local highs of December 11. The reason for the "bullish" dynamics of the instrument was the outcome of the Fed meeting on interest rates.
As expected, the regulator did not change the parameters of monetary policy, keeping the rate unchanged at 2.25–2.50%. The Fed noted strong growth in the employment market and overall economic activity in the country. Inflation may remain at the target level of 2% in the near future.
The day before a new round of trade negotiations between the US and China started. The charges against Huawei, a Chinese corporation, made investors question the outcome of the negotiations and the prospect of a trade deal, but the US officials were quick to reassure the market.
Support and resistance
Bollinger Bands in D1 chart show stable growth. The price range is widening but does not conform to the development of the "bullish" trend in the short term currently. MACD indicator is growing, keeping a stable buy signal (located above the signal line). Stochastic keeps its upward direction but is approaching its highs, which points at the risks of overbought instrument in the ultra-short term.
Existing long positions should be kept until the situation clears up.
Resistance levels: 0.6923, 0.6968, 0.7000.
Support levels: 0.6871, 0.6847, 0.6814, 0.6789.
Trading tips
To open long positions, one can rely on the breakout of 0.6923. Take profit — 0.7000. Stop loss — 0.6890. Implementation time: 1-2 days.
A rebound from 0.6923 as from resistance followed by a breakdown of 0.6871 may become a signal for corrective sales with the target at 0.6789. Stop loss — 0.6900 or 0.6910. Implementation time: 2-3 days.


No comments:
Write comments