
EUR/USD: general analysis
31 January 2019, 13:42
| Scenario | |
|---|---|
| Timeframe | Weekly |
| Recommendation | BUY STOP |
| Entry Point | 1.1500 |
| Take Profit | 1.1535, 1.1596 |
| Stop Loss | 1.1470 |
| Key Levels | 1.1352, 1.1413, 1.1474, 1.1535, 1.1596 |
| Alternative scenario | |
|---|---|
| Recommendation | SELL STOP |
| Entry Point | 1.1460 |
| Take Profit | 1.1413, 1.1352 |
| Stop Loss | 1.1500 |
| Key Levels | 1.1352, 1.1413, 1.1474, 1.1535, 1.1596 |
Current trend
Today, the EUR/USD pair is being corrected downwards after a significant increase on Wednesday.
Yesterday, USD was under pressure because of the results of the Fed meeting. The regulator decided to leave the interest rate within the range of 2.25% –2.50%, and in the accompanying statement, it was said that now the FOMC will remain patient and assess what changes in the rate may be required. At his press conference, Jerome Powell noted that currently there were fewer arguments in favor of a rate hike, so the Fed will take a wait-and-see approach. At the next meetings, officials will decide whether to stop the process of reducing assets on the balance of the regulator.
On Friday, January US labor market statistics will be published. The Unemployment Rate is expected to stay at 3.9%. Nonfarm Payrolls are expected to decline from 312K to 165K but statistics may be better than expected, as yesterday’s ADP employment data were positive.
Support and resistance
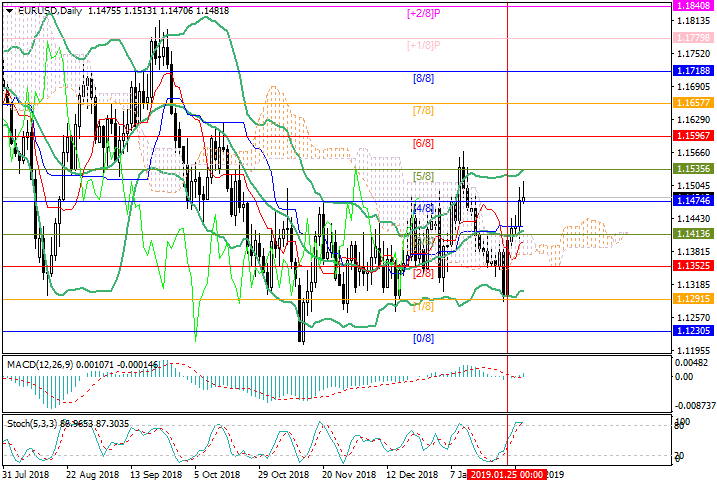
The price tests the level of 1.1474 (Murrey [4/8]), trying to return to the negative zone of the Murrey trading range. In this case, the decline to 1.1413 (the middle line of Bollinger bands, Murrey [3/8]) is possible. Otherwise, growth will resume to 1.1535 (Murrey [5/8]) and 1.1596 (Murrey [6/8]).
Technical indicators do not give a clear signal. Bollinger bands reverse upwards. MACD histogram grows in the positive zone. Stochastic reverses downwards in the overbought zone.
Resistance levels: 1.1535, 1.1596.
Support levels: 1.1474, 1.1413, 1.1352.
Trading tips
Long positions can be opened from 1.1500 with the targets at 1.1535, 1.1596 and stop loss around 1.1470.
Short positions can be opened from 1.1460 with the targets at 1.1413, 1.1352 and stop loss 1.1500.
Implementation period: 4–5 days.
Today, the EUR/USD pair is being corrected downwards after a significant increase on Wednesday.
Yesterday, USD was under pressure because of the results of the Fed meeting. The regulator decided to leave the interest rate within the range of 2.25% –2.50%, and in the accompanying statement, it was said that now the FOMC will remain patient and assess what changes in the rate may be required. At his press conference, Jerome Powell noted that currently there were fewer arguments in favor of a rate hike, so the Fed will take a wait-and-see approach. At the next meetings, officials will decide whether to stop the process of reducing assets on the balance of the regulator.
On Friday, January US labor market statistics will be published. The Unemployment Rate is expected to stay at 3.9%. Nonfarm Payrolls are expected to decline from 312K to 165K but statistics may be better than expected, as yesterday’s ADP employment data were positive.
Support and resistance
The price tests the level of 1.1474 (Murrey [4/8]), trying to return to the negative zone of the Murrey trading range. In this case, the decline to 1.1413 (the middle line of Bollinger bands, Murrey [3/8]) is possible. Otherwise, growth will resume to 1.1535 (Murrey [5/8]) and 1.1596 (Murrey [6/8]).
Technical indicators do not give a clear signal. Bollinger bands reverse upwards. MACD histogram grows in the positive zone. Stochastic reverses downwards in the overbought zone.
Resistance levels: 1.1535, 1.1596.
Support levels: 1.1474, 1.1413, 1.1352.
Trading tips
Long positions can be opened from 1.1500 with the targets at 1.1535, 1.1596 and stop loss around 1.1470.
Short positions can be opened from 1.1460 with the targets at 1.1413, 1.1352 and stop loss 1.1500.
Implementation period: 4–5 days.


No comments:
Write comments