
USD/JPY: wave analysis
13 November 2017, 08:46
| Scenario | |
|---|---|
| Timeframe | Weekly |
| Recommendation | SELL |
| Entry Point | 113.43 |
| Take Profit | 111.90 |
| Stop Loss | 114.10 |
| Key Levels | 111.90, 114.72, 116.00 |
| Alternative scenario | |
|---|---|
| Recommendation | BUY STOP |
| Entry Point | 114.80 |
| Take Profit | 116.00 |
| Stop Loss | 114.20 |
| Key Levels | 111.90, 114.72, 116.00 |
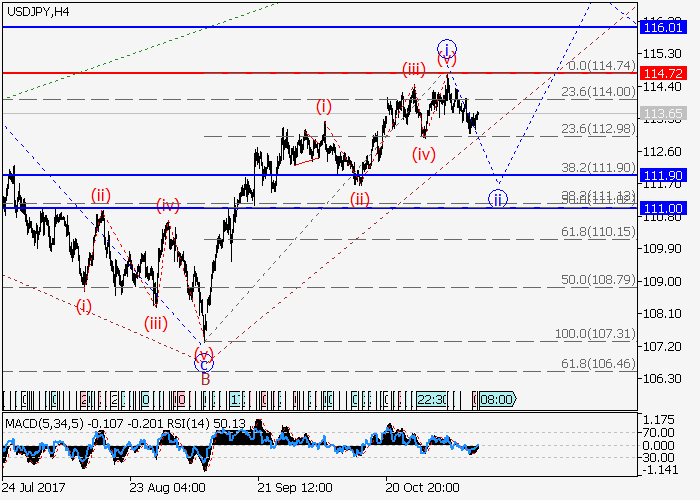
The pair is in correction, the fall is possible.
The wave C of the higher level, within which the first wave i of C has formed, is developing. At the moment the downward correction is developing as a second wave ii of С. If the assumption is correct, the pair will fall to the level of 111.90. The level of 114.72 is critical for this scenario.
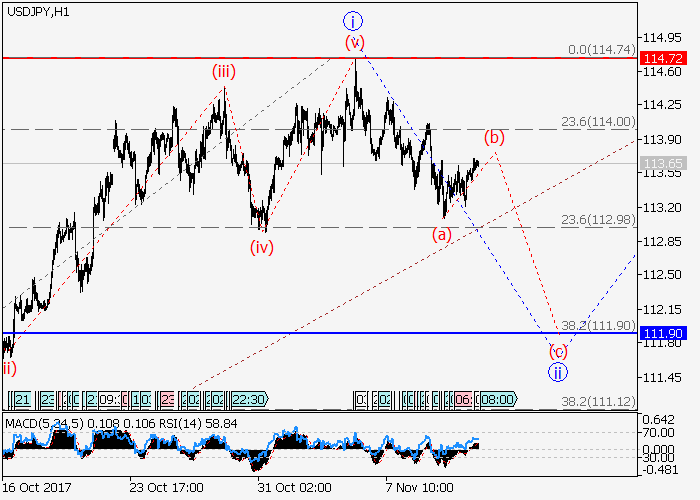
Main scenario
Short positions will become relevant during the correction, below the level of 114.72 with the target at 111.90.
Alternative scenario
The breakout and the consolidation of the price above the level of 114.72 will let the pair grow to the level of 116.00 and further.
The wave C of the higher level, within which the first wave i of C has formed, is developing. At the moment the downward correction is developing as a second wave ii of С. If the assumption is correct, the pair will fall to the level of 111.90. The level of 114.72 is critical for this scenario.
Main scenario
Short positions will become relevant during the correction, below the level of 114.72 with the target at 111.90.
Alternative scenario
The breakout and the consolidation of the price above the level of 114.72 will let the pair grow to the level of 116.00 and further.


No comments:
Write comments