
USD/JPY: general analysis
09 November 2017, 13:02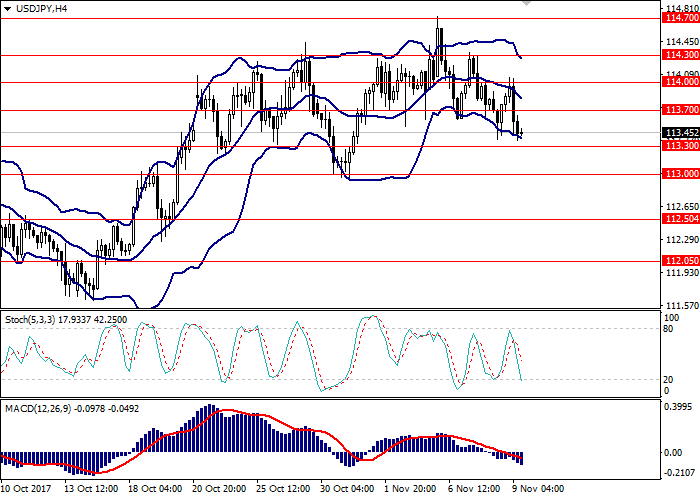
| Scenario | |
|---|---|
| Timeframe | Intraday |
| Recommendation | SELL |
| Entry Point | 113.47 |
| Take Profit | 113.00 |
| Stop Loss | 113.80 |
| Key Levels | 113.00, 113.30, 113.70, 114.00, 114.30, 114.70 |
| Alternative scenario | |
|---|---|
| Recommendation | BUY STOP |
| Entry Point | 114.00 |
| Take Profit | 114.70 |
| Stop Loss | 113.70 |
| Key Levels | 113.00, 113.30, 113.70, 114.00, 114.30, 114.70 |
Current trend
On Thursday the USD/JPY pair is going down after the inflation and economy growth forecasts publication by Bank of Japan. The growth of Japanese foreign trade balance to 852.2 billion yen affected the price positively. Eco Watchers current situation index, which is the key indicator of the short term Japanese economy trends, reached 52.2 points, exceeding the expectations by 1.5 points, which is positive for JPY.
Today the traders should pay attention to US Initial Jobless Claims publication: the high reading can affect USD negatively, and the air will continue to fall.
Support and resistance
On the 4-hour chart the instrument is trading around the lower border of Bollinger Bands. MACD histogram is in the negative zone, the signal line crosses the zero line and histogram’s body downwards, forming a sell signal.
Support levels: 113.30, 113.00.
Resistance levels: 113.70, 114.00, 114.30, 114.70.

Trading tips
Short positions can be opened at the current level with the target at 113.00 and stop loss at 113.80. Implementation period: 1-3 days.
Long positions can be opened from the level of 114.00 with the target at 114.70 and stop loss at 113.70. Implementation period: 3-5 days.
On Thursday the USD/JPY pair is going down after the inflation and economy growth forecasts publication by Bank of Japan. The growth of Japanese foreign trade balance to 852.2 billion yen affected the price positively. Eco Watchers current situation index, which is the key indicator of the short term Japanese economy trends, reached 52.2 points, exceeding the expectations by 1.5 points, which is positive for JPY.
Today the traders should pay attention to US Initial Jobless Claims publication: the high reading can affect USD negatively, and the air will continue to fall.
Support and resistance
On the 4-hour chart the instrument is trading around the lower border of Bollinger Bands. MACD histogram is in the negative zone, the signal line crosses the zero line and histogram’s body downwards, forming a sell signal.
Support levels: 113.30, 113.00.
Resistance levels: 113.70, 114.00, 114.30, 114.70.
Trading tips
Short positions can be opened at the current level with the target at 113.00 and stop loss at 113.80. Implementation period: 1-3 days.
Long positions can be opened from the level of 114.00 with the target at 114.70 and stop loss at 113.70. Implementation period: 3-5 days.


No comments:
Write comments