
GBP/USD: wave analysis
10 November 2017, 08:28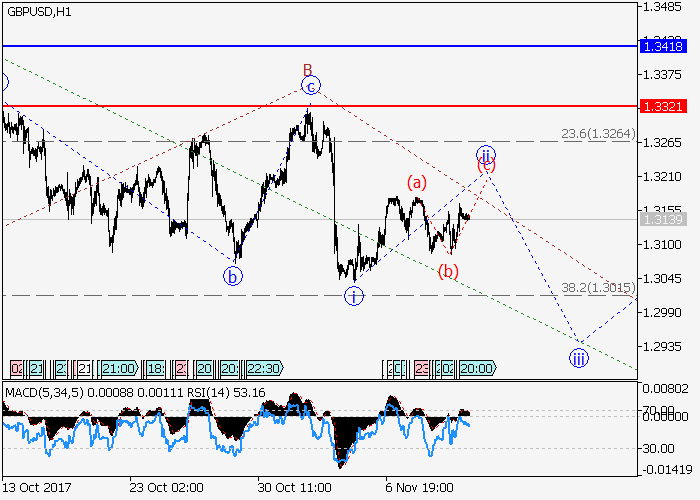
| Scenario | |
|---|---|
| Timeframe | Weekly |
| Recommendation | SELL |
| Entry Point | 1.3155 |
| Take Profit | 1.2810 |
| Stop Loss | 1.3270 |
| Key Levels | 1.2810, 1.3321, 1.3418 |
| Alternative scenario | |
|---|---|
| Recommendation | BUY STOP |
| Entry Point | 1.3330 |
| Take Profit | 1.3418 |
| Stop Loss | 1.3270 |
| Key Levels | 1.2810, 1.3321, 1.3418 |
The pair is in correction, the fall is possible.
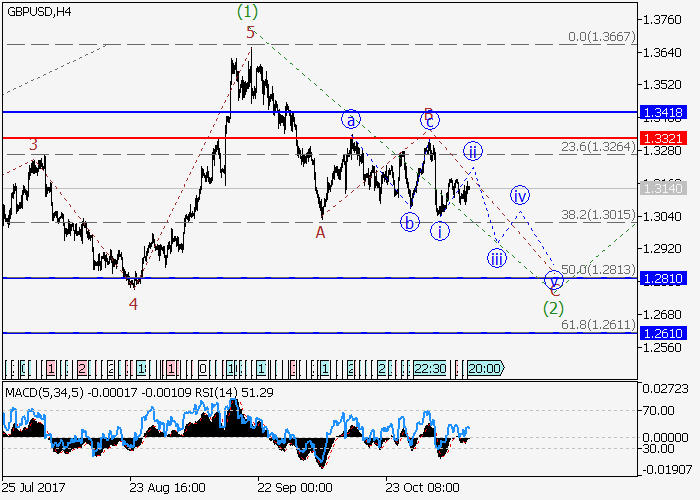
On the 4-hour chart the wave C is forming within the downward correction (2) of the higher level. Locally the upward correction is developing within the wave of the lower level ii of С. If the assumption is correct, the pair will fall to the level of 1.2810 after the end of the correction. The level of 1.3321 is critical for this scenario.

Main scenario
Short positions will become relevant during the correction, below the level of 1.3321 with the target at 1.2810.
Alternative scenario
The breakout and the consolidation of the price above the level of 1.3321 will let the pair grow to the level of 1.3418.
On the 4-hour chart the wave C is forming within the downward correction (2) of the higher level. Locally the upward correction is developing within the wave of the lower level ii of С. If the assumption is correct, the pair will fall to the level of 1.2810 after the end of the correction. The level of 1.3321 is critical for this scenario.
Main scenario
Short positions will become relevant during the correction, below the level of 1.3321 with the target at 1.2810.
Alternative scenario
The breakout and the consolidation of the price above the level of 1.3321 will let the pair grow to the level of 1.3418.


No comments:
Write comments