
Brent Crude Oil: waiting for new drivers
09 November 2017, 12:46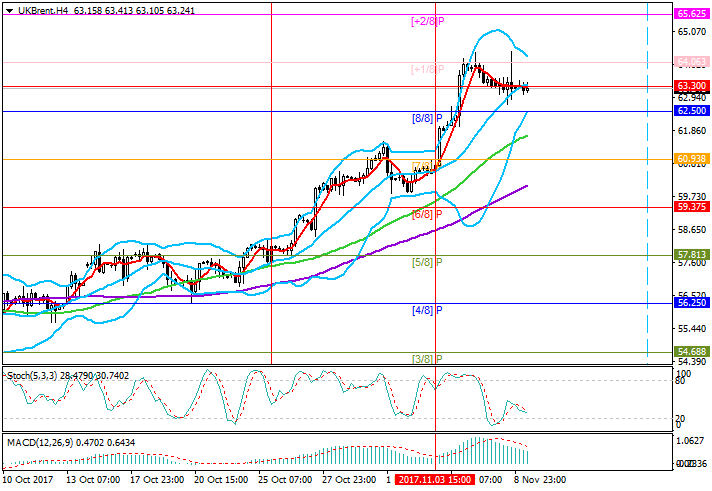
| Scenario | |
|---|---|
| Timeframe | Intraday |
| Recommendation | SELL STOP |
| Entry Point | 62.95 |
| Take Profit | 62.50, 59.37 |
| Stop Loss | 63.40 |
| Key Levels | 59.37, 60.93, 62.50, 64.06, 65.62, 66.00 |
| Alternative scenario | |
|---|---|
| Recommendation | BUY STOP |
| Entry Point | 64.10 |
| Take Profit | 65.62 |
| Stop Loss | 63.70 |
| Key Levels | 59.37, 60.93, 62.50, 64.06, 65.62, 66.00 |
Current trend
Oil quotes stabilized around 63.00-63.50 after a significant increase at the beginning of the week, connected with the arrests of the highest official and members of the royal family of Saudi Arabia.
Yesterday's data on US oil inventories from the EIA did not put serious pressure on prices, although, contrary to forecasts, crude oil reserves increased by 2.237 million barrels instead of the projected decrease of 2.800 million barrels. At the same time, the volume of oil production in the US rose to 9.62 million barrels per day.
Probably, the lull is connected with the expectation of monthly reports on the oil market from OPEC and IEA, the publication of which will take place on Monday and Tuesday and may lead to a surge in volatility. The key event of the month – the meeting of the OPEC countries in Vienna – is also approaching. The current agreement on the reduction of oil production is valid until March 31, 2018, but can be postponed to the end of next year.
Support and resistance
Technically, the price broke down the level of 64.06 (Murray's level [+1/8]) and dropped to the area of 62.50 (level Murray [8/8], the bottom line of the Bollinger Bands). In the case of breakdown of 62.50, the correction to the levels of 60.93 (level of Murray [7/8]) and 59.37 (level of Murray [6/8]) is likely. The key to the "bulls" is the level of 64.06, from which growth is possible to the area of 65.62 (level of Murray [+2/8]). Technical indicators show decrease: Stochastics is directed downwards, the MACD histogram is decreasing in the positive zone.
Support levels: 62.50, 60.93, 59.37.
Resistance levels: 64.06, 65.62, 66.00.

Trading tips
Short positions can be opened below 63.00 with targets 62.50, 59.37 and stop loss at 63.40.
Consolidation above 64.06 or price reversal at 62.50 will make long positions relevant with target at 65.62 and stop loss at the levels of 63.70 and 62.10.
Oil quotes stabilized around 63.00-63.50 after a significant increase at the beginning of the week, connected with the arrests of the highest official and members of the royal family of Saudi Arabia.
Yesterday's data on US oil inventories from the EIA did not put serious pressure on prices, although, contrary to forecasts, crude oil reserves increased by 2.237 million barrels instead of the projected decrease of 2.800 million barrels. At the same time, the volume of oil production in the US rose to 9.62 million barrels per day.
Probably, the lull is connected with the expectation of monthly reports on the oil market from OPEC and IEA, the publication of which will take place on Monday and Tuesday and may lead to a surge in volatility. The key event of the month – the meeting of the OPEC countries in Vienna – is also approaching. The current agreement on the reduction of oil production is valid until March 31, 2018, but can be postponed to the end of next year.
Support and resistance
Technically, the price broke down the level of 64.06 (Murray's level [+1/8]) and dropped to the area of 62.50 (level Murray [8/8], the bottom line of the Bollinger Bands). In the case of breakdown of 62.50, the correction to the levels of 60.93 (level of Murray [7/8]) and 59.37 (level of Murray [6/8]) is likely. The key to the "bulls" is the level of 64.06, from which growth is possible to the area of 65.62 (level of Murray [+2/8]). Technical indicators show decrease: Stochastics is directed downwards, the MACD histogram is decreasing in the positive zone.
Support levels: 62.50, 60.93, 59.37.
Resistance levels: 64.06, 65.62, 66.00.
Trading tips
Short positions can be opened below 63.00 with targets 62.50, 59.37 and stop loss at 63.40.
Consolidation above 64.06 or price reversal at 62.50 will make long positions relevant with target at 65.62 and stop loss at the levels of 63.70 and 62.10.


No comments:
Write comments