Adobe Systems Incorporated (ADBE/NASD)
09 November 2017, 13:07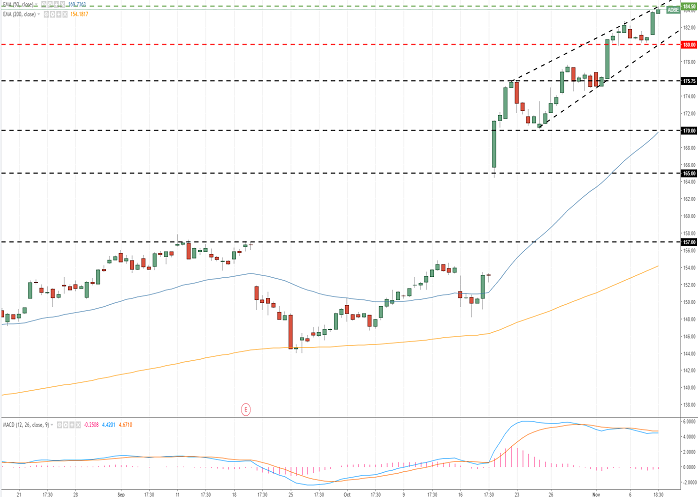
| Scenario | |
|---|---|
| Timeframe | Intraday |
| Recommendation | SELL STOP |
| Entry Point | 179.90 |
| Take Profit | 177.00, 175.00, 173.00 |
| Stop Loss | 183.00 |
| Key Levels | 170.00, 175.75, 180.00, 184.50 |
| Alternative scenario | |
|---|---|
| Recommendation | BUY STOP |
| Entry Point | 184.60 |
| Take Profit | 189.00, 191.00 |
| Stop Loss | 182.00 |
| Key Levels | 170.00, 175.75, 180.00, 184.50 |
Current trend
Over the past three weeks, Adobe shares have updated the historical maximum for six times already, having consolidated above $184. Growth was caused by the October increase of the forecast for the financial year 2018, as well as increased volatility in the technology sector amid expectations of the new tax reform and the season of holiday sales in the US. Since the beginning of this quarter, Adobe shares have brought investors more than 24% of profits, the total growth since early 2017 has exceeded 79%.
Over the last week, Adobe shares rose by 4.43%. The S&P 500 index for the same period increased by 0.24%.
Support and resistance
The technical picture indicates a possible correction of #ADBE after significant growth over the past two months. At the moment, the classical figure of the technical analysis, Ascending Wedge, was formed, which often acts as a reversal formation. The confirming signal is the MACD indicator: the histogram is in the negative zone and continues to decrease.
A comparative analysis of the company's multipliers and competing companies in the industry shows that #ADBE is undervalued.
Support levels: 180.00, 175.75, 170.00.
Resistance levels: 184.50.

Trading tips
If the price consolidates below 180.00, the correction is expected. Stop loss will be located at around 183.00. Potential profit levels are 177.00, 175.00 and 173.00.
If the price consolidates above the local resistance of 184.50, long positions will become relevant with the targets within the range of 189.00-191.00. Stop loss can be set at 182.00.
Trading scenarios will be relevant for 3-4 days.
Over the past three weeks, Adobe shares have updated the historical maximum for six times already, having consolidated above $184. Growth was caused by the October increase of the forecast for the financial year 2018, as well as increased volatility in the technology sector amid expectations of the new tax reform and the season of holiday sales in the US. Since the beginning of this quarter, Adobe shares have brought investors more than 24% of profits, the total growth since early 2017 has exceeded 79%.
Over the last week, Adobe shares rose by 4.43%. The S&P 500 index for the same period increased by 0.24%.
Support and resistance
The technical picture indicates a possible correction of #ADBE after significant growth over the past two months. At the moment, the classical figure of the technical analysis, Ascending Wedge, was formed, which often acts as a reversal formation. The confirming signal is the MACD indicator: the histogram is in the negative zone and continues to decrease.
A comparative analysis of the company's multipliers and competing companies in the industry shows that #ADBE is undervalued.
Support levels: 180.00, 175.75, 170.00.
Resistance levels: 184.50.
Trading tips
If the price consolidates below 180.00, the correction is expected. Stop loss will be located at around 183.00. Potential profit levels are 177.00, 175.00 and 173.00.
If the price consolidates above the local resistance of 184.50, long positions will become relevant with the targets within the range of 189.00-191.00. Stop loss can be set at 182.00.
Trading scenarios will be relevant for 3-4 days.