USD/JPY: the US dollar is dropping
05 August 2019, 10:14
| Scenario | |
|---|---|
| Timeframe | Intraday |
| Recommendation | BUY STOP |
| Entry Point | 106.35, 106.50 |
| Take Profit | 107.52, 107.78 |
| Stop Loss | 105.90, 105.77 |
| Key Levels | 105.00, 105.23, 105.77, 106.00, 106.44, 106.75, 107.20, 107.52 |
| Alternative scenario | |
|---|---|
| Recommendation | SELL STOP |
| Entry Point | 105.90 |
| Take Profit | 105.23, 105.00 |
| Stop Loss | 106.44 |
| Key Levels | 105.00, 105.23, 105.77, 106.00, 106.44, 106.75, 107.20, 107.52 |
Current trend
USD closed last week with a steady decline against JPY, updating local lows of the beginning of the year. Despite the publication of a moderately optimistic report on the US labor market, the dollar is lower than the yen amid a decline in investor interest in risk. The minutes of Bank of Japan meeting published on Friday also contributed to a moderate increase in the Japanese currency, since they did not explicitly indicate a resumption of monetary easing in the foreseeable future.
During today's Asian session, USD is trading with a decrease. Even the appearance of weak macroeconomic statistics from Japan does not impede the development of the "bearish" trend. Markit Services PMI in July decreased from 51.9 to 51.8 points with the forecast of the increase to 52.3 points.
Support and resistance
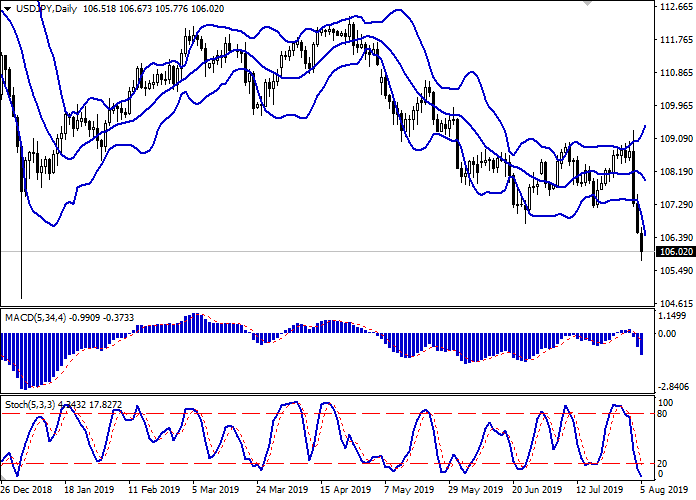
Bollinger Bands in D1 chart demonstrate a stable decrease. The price range is widening but does not conform to the development of the "bearish" trend yet. MACD is going down preserving a stable sell signal (located below the signal line). Stochastic retains stable downward direction but is located in close proximity to its lows, which indicates the instrument's strong oversold in the ultra-short term.
It is necessary to wait for emergence of updated signals from technical indicators.
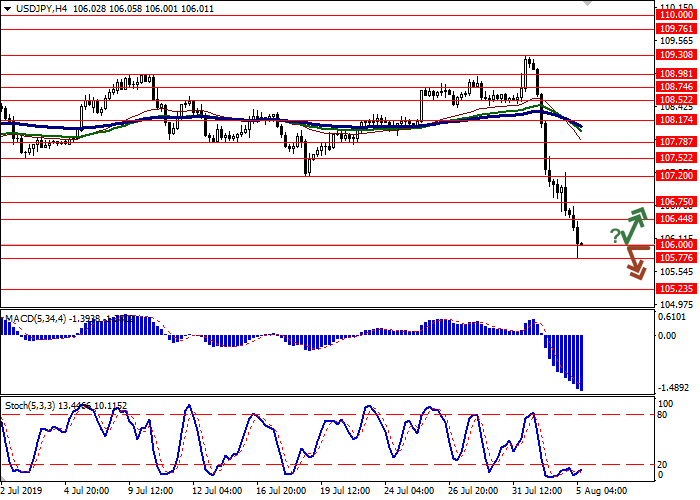
Resistance levels: 106.44, 106.75, 107.20, 107.52.
Support levels: 106.00, 105.77, 105.23, 105.00.


Trading tips
To open long positions, one can rely on the rebound from the support level of 106.00 with the subsequent breakout of 106.30–106.44. Take profit — 107.52 or 107.78. Stop loss — 105.90–105.77. Implementation time: 2-3 days.
A breakdown of 106.00 may be a signal for new sales with target at 105.23 or 105.00. Stop loss — 106.44. Implementation time: 1-2 days.
USD closed last week with a steady decline against JPY, updating local lows of the beginning of the year. Despite the publication of a moderately optimistic report on the US labor market, the dollar is lower than the yen amid a decline in investor interest in risk. The minutes of Bank of Japan meeting published on Friday also contributed to a moderate increase in the Japanese currency, since they did not explicitly indicate a resumption of monetary easing in the foreseeable future.
During today's Asian session, USD is trading with a decrease. Even the appearance of weak macroeconomic statistics from Japan does not impede the development of the "bearish" trend. Markit Services PMI in July decreased from 51.9 to 51.8 points with the forecast of the increase to 52.3 points.
Support and resistance
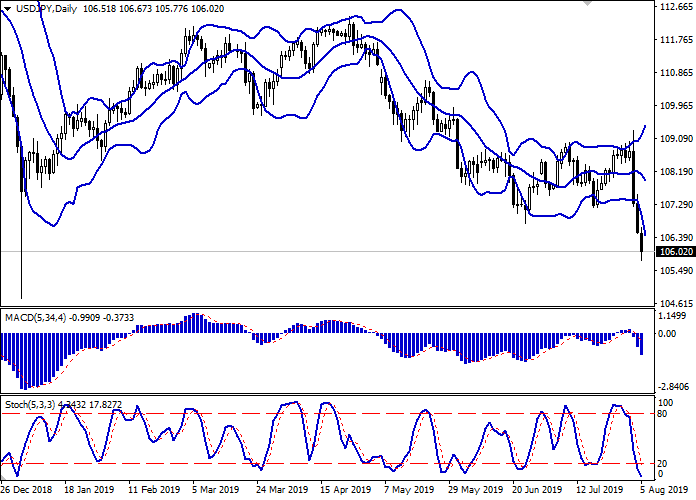
Bollinger Bands in D1 chart demonstrate a stable decrease. The price range is widening but does not conform to the development of the "bearish" trend yet. MACD is going down preserving a stable sell signal (located below the signal line). Stochastic retains stable downward direction but is located in close proximity to its lows, which indicates the instrument's strong oversold in the ultra-short term.
It is necessary to wait for emergence of updated signals from technical indicators.
Resistance levels: 106.44, 106.75, 107.20, 107.52.
Support levels: 106.00, 105.77, 105.23, 105.00.


Trading tips
To open long positions, one can rely on the rebound from the support level of 106.00 with the subsequent breakout of 106.30–106.44. Take profit — 107.52 or 107.78. Stop loss — 105.90–105.77. Implementation time: 2-3 days.
A breakdown of 106.00 may be a signal for new sales with target at 105.23 or 105.00. Stop loss — 106.44. Implementation time: 1-2 days.


No comments:
Write comments