USD/CAD: the instrument is strengthening
05 August 2019, 10:07
| Scenario | |
|---|---|
| Timeframe | Intraday |
| Recommendation | BUY STOP |
| Entry Point | 1.3245, 1.3255 |
| Take Profit | 1.3320, 1.3330 |
| Stop Loss | 1.3210 |
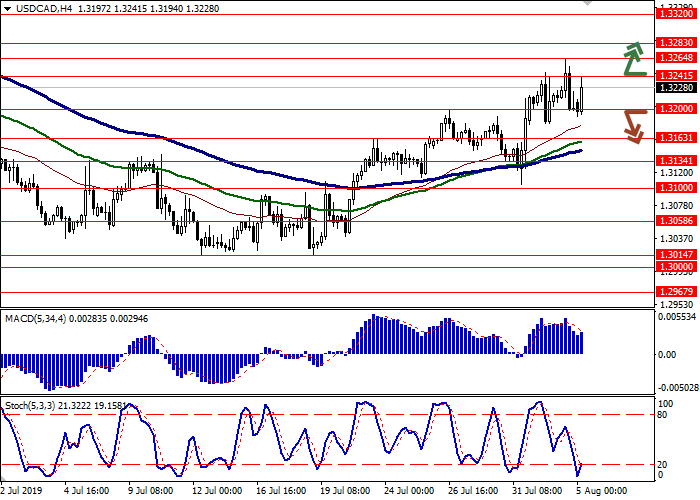
| Key Levels | 1.3100, 1.3134, 1.3163, 1.3200, 1.3241, 1.3264, 1.3283, 1.3320 |
| Alternative scenario | |
|---|---|
| Recommendation | SELL STOP |
| Entry Point | 1.3195 |
| Take Profit | 1.3100 |
| Stop Loss | 1.3250 |
| Key Levels | 1.3100, 1.3134, 1.3163, 1.3200, 1.3241, 1.3264, 1.3283, 1.3320 |
Current trend
On Friday, the USD/CAD pair slightly decreased, although that during the day the instrument was trading upwards and renewed its highs since June 20. Investors rather coldly met the publication of the July report on the US labor market, which reflected the steady growth of new jobs in the American economy by 164K. The July average hourly wage rose from +3.1% YoY to +3.2% YoY, which was better than analysts' neutral forecasts.
Canadian statistics, in turn, was very uncertain. Thus, exports from Canada in June fell from $53 billion to $50.31 billion, which turned out to be worse than analysts' forecasts of $51.50 billion. Imports also fell from $52.43 billion to $50.17 billion against the forecast of $51.80 billion. Trade surplus balance in June fell from $0.56 billion to $0.14 billion.
Support and resistance
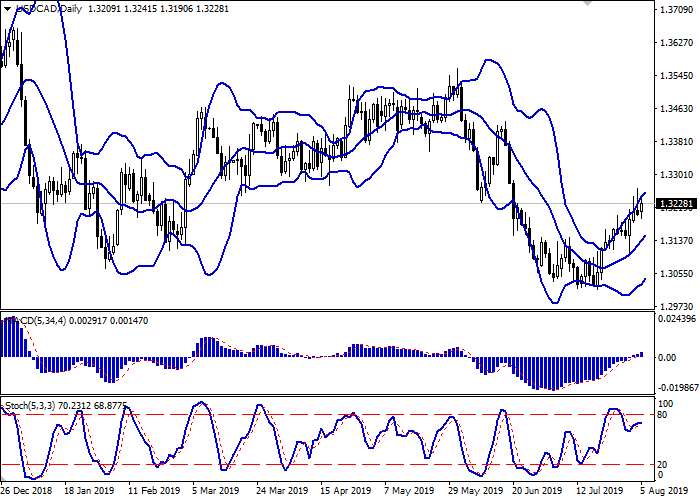
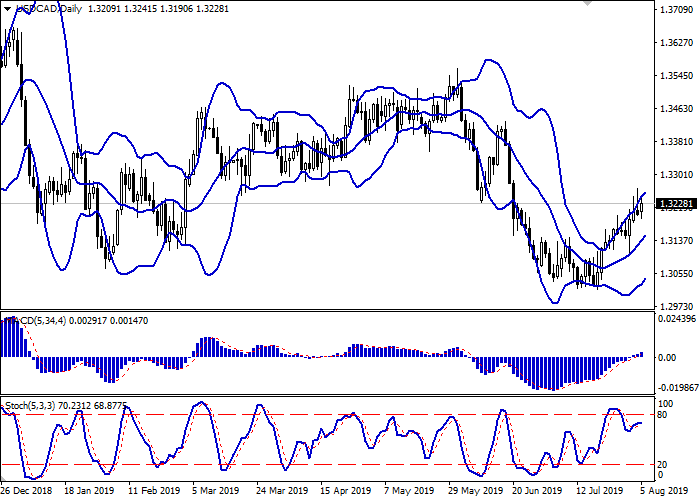
On the daily chart, Bollinger bands are growing steadily. The price range is narrowing, reflecting the emergence of ambiguous trading dynamics in recent days. The MACD indicator is growing, keeping a poor buy signal (the histogram is above the signal line), and is trying to consolidate above the zero line. Stochastic, approaching its highs, reversed, indicating that the possibility of USD becoming overbought in the ultra-short term is growing.
It is better to keep current long positions until the market situation becomes clear.
Resistance levels: 1.3241, 1.3264, 1.3283, 1.3320.
Support Levels: 1.3200, 1.3163, 1.3134, 1.3100.


Trading tips
Long positions can be opened after the breakout of 1.3241–1.3250 with the targets at 1.3320–1.3330. Stop loss – 1.3210. Implementation period: 1–2 days.
Short positions can be opened after the breakdown of 1.3200 with the target at 1.3100. Stop loss – 1.3250. Implementation period: 2–3 days.
On Friday, the USD/CAD pair slightly decreased, although that during the day the instrument was trading upwards and renewed its highs since June 20. Investors rather coldly met the publication of the July report on the US labor market, which reflected the steady growth of new jobs in the American economy by 164K. The July average hourly wage rose from +3.1% YoY to +3.2% YoY, which was better than analysts' neutral forecasts.
Canadian statistics, in turn, was very uncertain. Thus, exports from Canada in June fell from $53 billion to $50.31 billion, which turned out to be worse than analysts' forecasts of $51.50 billion. Imports also fell from $52.43 billion to $50.17 billion against the forecast of $51.80 billion. Trade surplus balance in June fell from $0.56 billion to $0.14 billion.
Support and resistance
On the daily chart, Bollinger bands are growing steadily. The price range is narrowing, reflecting the emergence of ambiguous trading dynamics in recent days. The MACD indicator is growing, keeping a poor buy signal (the histogram is above the signal line), and is trying to consolidate above the zero line. Stochastic, approaching its highs, reversed, indicating that the possibility of USD becoming overbought in the ultra-short term is growing.
It is better to keep current long positions until the market situation becomes clear.
Resistance levels: 1.3241, 1.3264, 1.3283, 1.3320.
Support Levels: 1.3200, 1.3163, 1.3134, 1.3100.


Trading tips
Long positions can be opened after the breakout of 1.3241–1.3250 with the targets at 1.3320–1.3330. Stop loss – 1.3210. Implementation period: 1–2 days.
Short positions can be opened after the breakdown of 1.3200 with the target at 1.3100. Stop loss – 1.3250. Implementation period: 2–3 days.


No comments:
Write comments