GBP/USD: the pound was corrected
05 August 2019, 10:13
| Scenario | |
|---|---|
| Timeframe | Intraday |
| Recommendation | BUY STOP |
| Entry Point | 1.2210 |
| Take Profit | 1.2380 |
| Stop Loss | 1.2150, 1.2140 |
| Key Levels | 1.2000, 1.2037, 1.2077, 1.2117, 1.2200, 1.2248, 1.2282, 1.2334 |
| Alternative scenario | |
|---|---|
| Recommendation | SELL |
| Entry Point | 1.2115 |
| Take Profit | 1.2000 |
| Stop Loss | 1.2200, 1.2215 |
| Key Levels | 1.2000, 1.2037, 1.2077, 1.2117, 1.2200, 1.2248, 1.2282, 1.2334 |
Current trend
At the end of the last trading week, the GBP/USD pair rose moderately, being slightly corrected after a powerful “bearish” rally, which brought GBP to record lows of January 2017. Friday’s strengthening of the instrument technical, since the macroeconomic background did not support GBP, and the previous negative factors associated with Brexit only intensified as the deadline approached. The British Construction PMI, published on Friday, rose slightly from 43.1 to 45.3 points in July, which turned out to be worse than market expectations of 46.0 points. The July US labor market report moderately supported the dollar. Nonfarm Payrolls reached 164K, which completely coincided with the estimates of analysts. Last month, the indicator increased by 193K. The average hourly wage indicator accelerated from +3.1% YoY to + 3.2% YoY in July.
Support and resistance
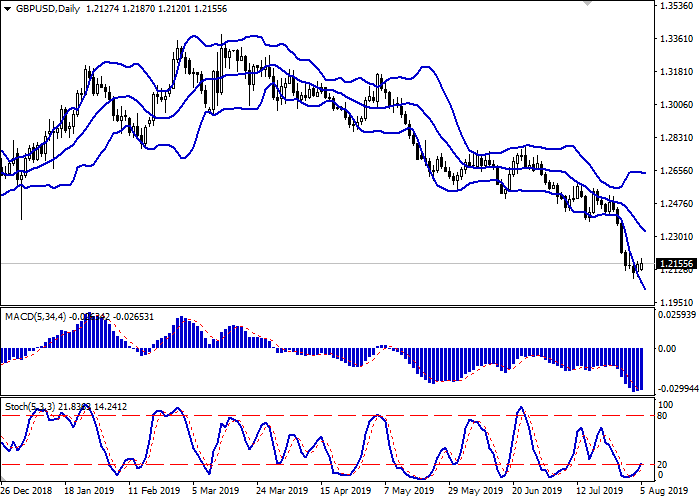
On the daily chart, Bollinger bands steadily decline. The price range narrows from above, reflecting the appearance of ambiguous dynamics in the short term. The MACD reversed upwards, formed a poor buy signal (the histogram is above the signal line). Stochastic stepped off its lows, indicating the prospects for the development of a full upward correction in the short and/or ultra-short term.
It is better to open new long positions until new signals from technical indicators appear.
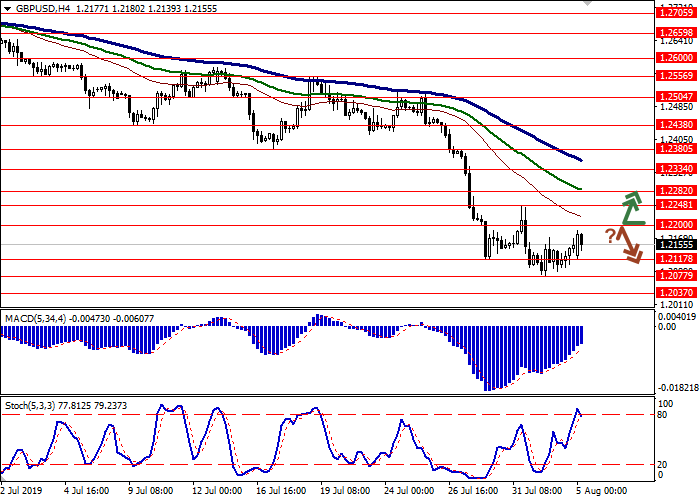
Resistance levels: 1.2200, 1.2248, 1.2282, 1.2334.
Support levels: 1.2117, 1.2077, 1.2037, 1.2000.


Trading tips
Long positions can be opened after the breakout of 1.2200 with the target at 1.2380. Stop loss – 1.2150–1.2140.
Short positions can be opened after a rebound from 1.2200 and a breakdown of 1.2150 with the target at 1.2000. Stop loss – 1.2200–1.2215.
Implementation period: 2–3 days.
At the end of the last trading week, the GBP/USD pair rose moderately, being slightly corrected after a powerful “bearish” rally, which brought GBP to record lows of January 2017. Friday’s strengthening of the instrument technical, since the macroeconomic background did not support GBP, and the previous negative factors associated with Brexit only intensified as the deadline approached. The British Construction PMI, published on Friday, rose slightly from 43.1 to 45.3 points in July, which turned out to be worse than market expectations of 46.0 points. The July US labor market report moderately supported the dollar. Nonfarm Payrolls reached 164K, which completely coincided with the estimates of analysts. Last month, the indicator increased by 193K. The average hourly wage indicator accelerated from +3.1% YoY to + 3.2% YoY in July.
Support and resistance
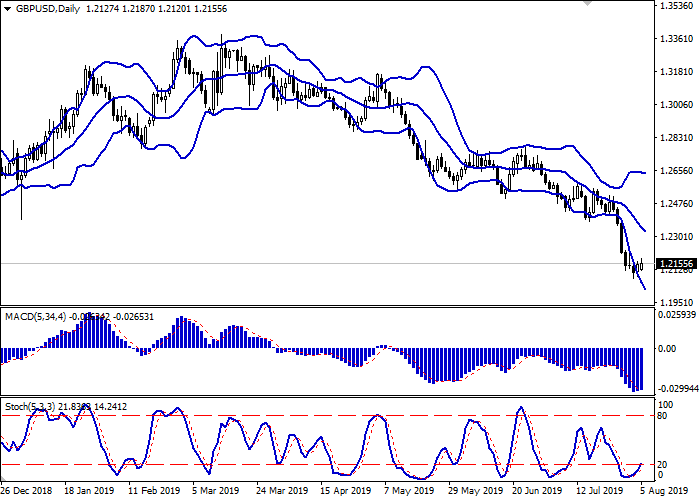
On the daily chart, Bollinger bands steadily decline. The price range narrows from above, reflecting the appearance of ambiguous dynamics in the short term. The MACD reversed upwards, formed a poor buy signal (the histogram is above the signal line). Stochastic stepped off its lows, indicating the prospects for the development of a full upward correction in the short and/or ultra-short term.
It is better to open new long positions until new signals from technical indicators appear.
Resistance levels: 1.2200, 1.2248, 1.2282, 1.2334.
Support levels: 1.2117, 1.2077, 1.2037, 1.2000.


Trading tips
Long positions can be opened after the breakout of 1.2200 with the target at 1.2380. Stop loss – 1.2150–1.2140.
Short positions can be opened after a rebound from 1.2200 and a breakdown of 1.2150 with the target at 1.2000. Stop loss – 1.2200–1.2215.
Implementation period: 2–3 days.


No comments:
Write comments