
USD/JPY: USD remains under pressure
10 January 2019, 09:17
| Scenario | |
|---|---|
| Timeframe | Intraday |
| Recommendation | BUY STOP |
| Entry Point | 108.05 |
| Take Profit | 110.00 |
| Stop Loss | 107.30 |
| Key Levels | 106.44, 107.00, 107.47, 108.00, 108.52, 109.07, 110.00, 110.45 |
| Alternative scenario | |
|---|---|
| Recommendation | SELL STOP |
| Entry Point | 107.40, 107.25 |
| Take Profit | 105.88, 105.58 |
| Stop Loss | 108.00 |
| Key Levels | 106.44, 107.00, 107.47, 108.00, 108.52, 109.07, 110.00, 110.45 |
Current trend
USD showed a decline against JPY on Wednesday, leveling off growth at the beginning of the current trading week. The main reason for the emergence of "bearish" dynamics was quite cautious Fed protocols, published the day before.
Heads of the regulator pointed out the expediency of “a certain increase in the rate”, however any exact dates were not named. In addition, the protocols reflected growing uncertainty about risks in the global economy and low inflationary expectations in the United States.
In turn, JPY is under pressure from the US-China trade negotiations. The prospect of their success makes investors withdraw from the safe-haven asset and invest in other currencies. Meanwhile, Wednesday's Japanese average cash earnings data grew by 2.0%, which is the most significant indicator since last August and the World Bank raised the growth forecast for the Japanese economy in 2019 from 0.8% to 0.9%.
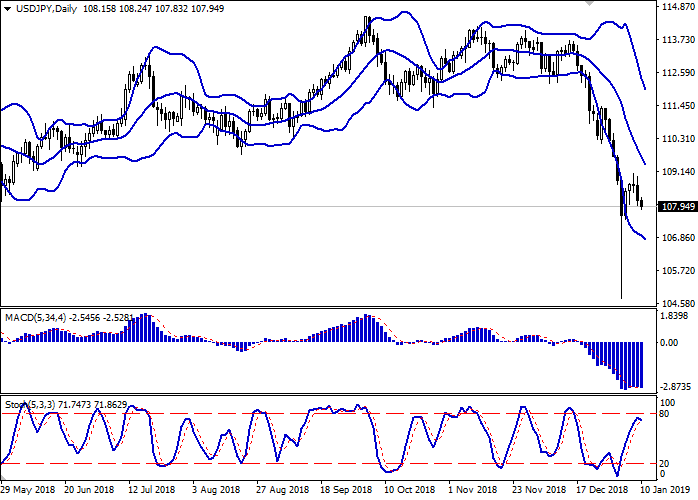
Support and resistance
Bollinger Bands in D1 chart demonstrate a stable decrease. The price range is actively narrowing, but still remains quite spacious for the current trend at the market. MACD is reversing downwards recovering a sell signal (located below the signal line). Stochastic shows similar dynamics, reversing downwards near the level of "80", which is a formal margin of oversold USD.
The further development of the downtrend is possible in the short and/or ultra-short term.
Resistance levels: 108.52, 109.07, 110.00, 110.45.
Support levels: 108.00, 107.47, 107.00, 106.44.
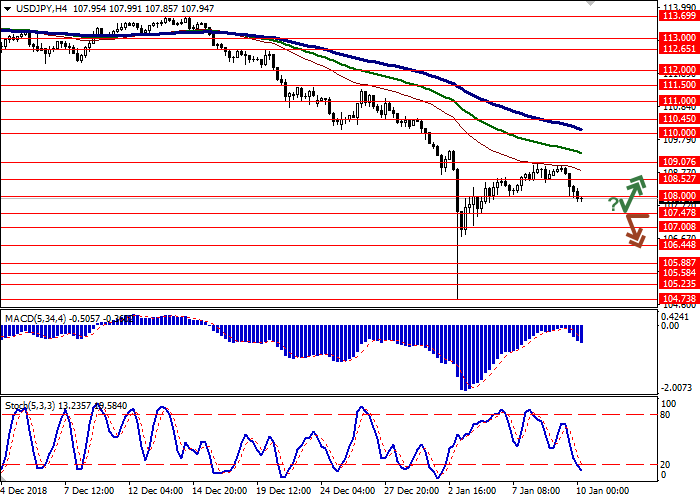
Trading tips
Long positions can be opened if the price rebounds from 107.47 followed by the breakout of 108.00. Take profit — 110.00. Stop loss — 107.30.
A breakdown of 107.47 or 107.30 may be a signal to further sales with target at 105.88 or 105.58. Stop loss — 108.00.
Implementation period: 2-3 days.
USD showed a decline against JPY on Wednesday, leveling off growth at the beginning of the current trading week. The main reason for the emergence of "bearish" dynamics was quite cautious Fed protocols, published the day before.
Heads of the regulator pointed out the expediency of “a certain increase in the rate”, however any exact dates were not named. In addition, the protocols reflected growing uncertainty about risks in the global economy and low inflationary expectations in the United States.
In turn, JPY is under pressure from the US-China trade negotiations. The prospect of their success makes investors withdraw from the safe-haven asset and invest in other currencies. Meanwhile, Wednesday's Japanese average cash earnings data grew by 2.0%, which is the most significant indicator since last August and the World Bank raised the growth forecast for the Japanese economy in 2019 from 0.8% to 0.9%.
Support and resistance
Bollinger Bands in D1 chart demonstrate a stable decrease. The price range is actively narrowing, but still remains quite spacious for the current trend at the market. MACD is reversing downwards recovering a sell signal (located below the signal line). Stochastic shows similar dynamics, reversing downwards near the level of "80", which is a formal margin of oversold USD.
The further development of the downtrend is possible in the short and/or ultra-short term.
Resistance levels: 108.52, 109.07, 110.00, 110.45.
Support levels: 108.00, 107.47, 107.00, 106.44.
Trading tips
Long positions can be opened if the price rebounds from 107.47 followed by the breakout of 108.00. Take profit — 110.00. Stop loss — 107.30.
A breakdown of 107.47 or 107.30 may be a signal to further sales with target at 105.88 or 105.58. Stop loss — 108.00.
Implementation period: 2-3 days.


No comments:
Write comments