
USD/CAD: the pair is steadily declining
10 January 2019, 08:58
| Scenario | |
|---|---|
| Timeframe | Intraday |
| Recommendation | BUY STOP |
| Entry Point | 1.3270 |
| Take Profit | 1.3368, 1.3400, 1.3419 |
| Stop Loss | 1.3220, 1.3210 |
| Key Levels | 1.3100, 1.3140, 1.3179, 1.3200, 1.3264, 1.3321, 1.3368, 1.3419 |
| Alternative scenario | |
|---|---|
| Recommendation | SELL STOP |
| Entry Point | 1.3195 |
| Take Profit | 1.3100 |
| Stop Loss | 1.3250 |
| Key Levels | 1.3100, 1.3140, 1.3179, 1.3200, 1.3264, 1.3321, 1.3368, 1.3419 |
Current trend
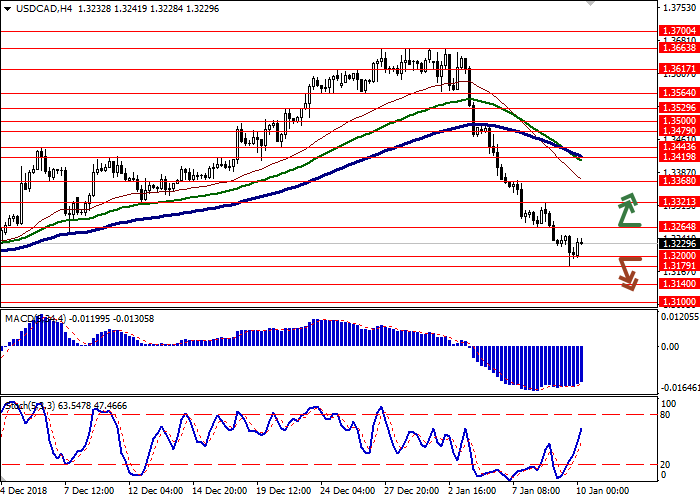
Since January 2, the USD/CAD pair is rapidly declining. In just a few days, the course has collapsed to local lows since December 4, 2018.
Yesterday investors were focused on Fed Meeting Minutes and the decision of the Bank of Canada on the interest rate. As expected, the regulator left the interest rate at the previous level of 1.75%, while the bank's comments were quite cautious and did not render any significant support for the Canadian currency. The regulator lamented the significant decline in oil prices, which led to a slowdown in wage growth. In addition, due to low hydrocarbon prices, the Bank of Canada revised its forecasts for economic growth in 2019. From the previous level of 2.1% YoY, the forecast was reduced to 1.7% YoY.
Support and resistance
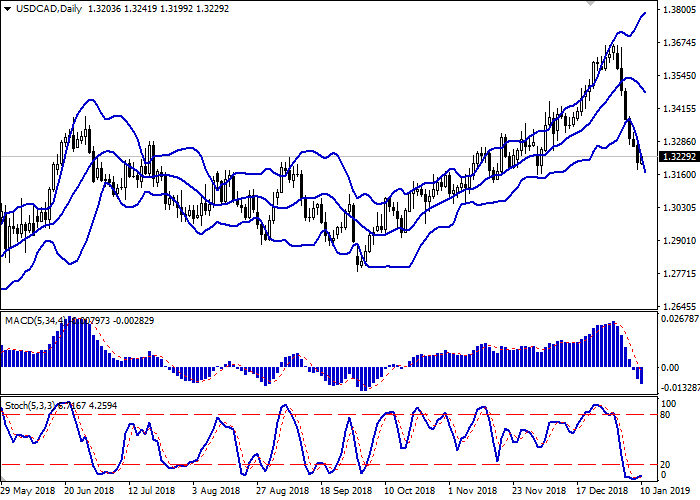
On the daily chart, Bollinger bands are steadily declining. The price range is actively expanding but not as fast as the “bearish” dynamics is developing. MACD indicator is falling, keeping a strong sell signal (the histogram is below the signal line). Stochastic, reaching its lows, is trying to reverse upwards, reflecting that the instrument is highly oversold in the short and super short term.
It is better to keep current short positions until the appearance of strong correction signals.
Resistance levels: 1.3264, 1.3321, 1.3368, 1.3419.
Support levels: 1.3200, 1.3179, 1.3140, 1.3100.
Trading tips
Long positions can be opened after the breakout of the level of 1.3264 with the targets at 1.3368 or 1.3400–1.3419. Stop loss is 1.3220–1.3210. Implementation period: 2–3 days.
Short positions can be opened after the breakdown of the level of 1.3200 with the target at 1.3100. Stop loss is 1.3250. Implementation period: 1–2 days.
Since January 2, the USD/CAD pair is rapidly declining. In just a few days, the course has collapsed to local lows since December 4, 2018.
Yesterday investors were focused on Fed Meeting Minutes and the decision of the Bank of Canada on the interest rate. As expected, the regulator left the interest rate at the previous level of 1.75%, while the bank's comments were quite cautious and did not render any significant support for the Canadian currency. The regulator lamented the significant decline in oil prices, which led to a slowdown in wage growth. In addition, due to low hydrocarbon prices, the Bank of Canada revised its forecasts for economic growth in 2019. From the previous level of 2.1% YoY, the forecast was reduced to 1.7% YoY.
Support and resistance
On the daily chart, Bollinger bands are steadily declining. The price range is actively expanding but not as fast as the “bearish” dynamics is developing. MACD indicator is falling, keeping a strong sell signal (the histogram is below the signal line). Stochastic, reaching its lows, is trying to reverse upwards, reflecting that the instrument is highly oversold in the short and super short term.
It is better to keep current short positions until the appearance of strong correction signals.
Resistance levels: 1.3264, 1.3321, 1.3368, 1.3419.
Support levels: 1.3200, 1.3179, 1.3140, 1.3100.
Trading tips
Long positions can be opened after the breakout of the level of 1.3264 with the targets at 1.3368 or 1.3400–1.3419. Stop loss is 1.3220–1.3210. Implementation period: 2–3 days.
Short positions can be opened after the breakdown of the level of 1.3200 with the target at 1.3100. Stop loss is 1.3250. Implementation period: 1–2 days.


No comments:
Write comments