
XAG/USD: technical analysis
07 September 2017, 12:52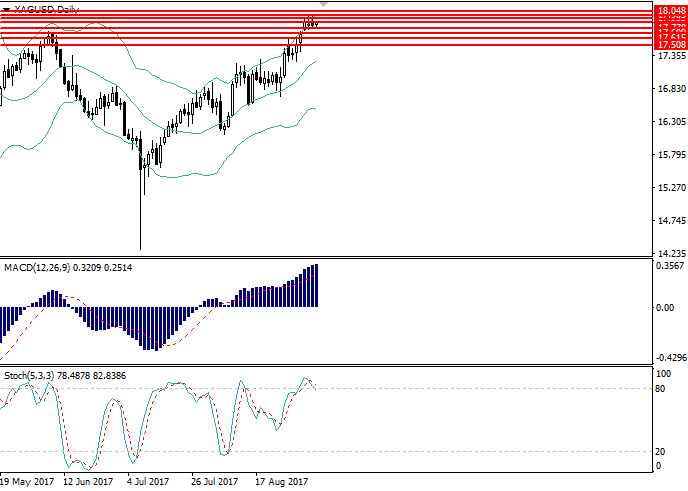
| Scenario | |
|---|---|
| Timeframe | Intraday |
| Recommendation | BUY |
| Entry Point | 17.88 |
| Take Profit | 18.20, 18.35 |
| Stop Loss | 17.70 |
| Key Levels | 17.50, 17.60, 17.70, 17.78, 17.85, 17.94, 18.00, 18.05 |
| Alternative scenario | |
|---|---|
| Recommendation | SELL STOP |
| Entry Point | 17.75 |
| Take Profit | 17.35, 17.15 |
| Stop Loss | 17.95 |
| Key Levels | 17.50, 17.60, 17.70, 17.78, 17.85, 17.94, 18.00, 18.05 |
XAG/USD, D1
On the daily chart the instrument is trading near the upper border of the Bollinger Bands. The indicator is pointed upwards, as the price range is widen, which reflect the development of the current trend. MACD histogram is in the positive zone, its volumes are increasing, keeping a strong buy signal. Stochastic is leaving the overbought area, forming a strong sell signal.

XAG/USD, H4
On the 4-hour chart the instrument has consolidated above the strong resistance level of 17.85. Bollinger Bands are reversing sideways, as the price range has significantly narrowed, reflecting the change of the current trend in the nearest future. MACD histogram is in the positive zone, keeping a buy signal. Stochastic has reversed upwards near the border of the oversold area.
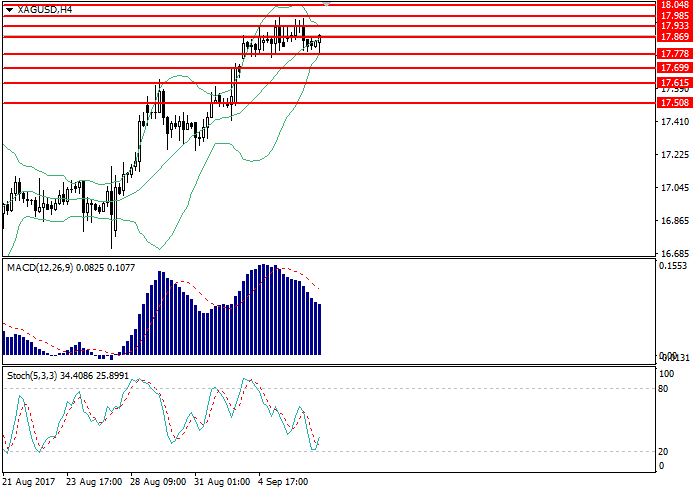
Key levels
Support levels: 17.50, 17.60, 17.70, 17.78.
Resistance levels: 17.85, 17.94, 18.00, 18.05.
Trading tips
Long positions can be opened at the current price with the targets at 18.20, 18.35 and stop loss at 17.70. Implementation period: 1-2 days.
Short positions can be opened at the level of 17.75 with the targets at 17.35, 17.15 and stop loss at 17.95. Implementation period: 1-2 days.
On the daily chart the instrument is trading near the upper border of the Bollinger Bands. The indicator is pointed upwards, as the price range is widen, which reflect the development of the current trend. MACD histogram is in the positive zone, its volumes are increasing, keeping a strong buy signal. Stochastic is leaving the overbought area, forming a strong sell signal.
XAG/USD, H4
On the 4-hour chart the instrument has consolidated above the strong resistance level of 17.85. Bollinger Bands are reversing sideways, as the price range has significantly narrowed, reflecting the change of the current trend in the nearest future. MACD histogram is in the positive zone, keeping a buy signal. Stochastic has reversed upwards near the border of the oversold area.
Key levels
Support levels: 17.50, 17.60, 17.70, 17.78.
Resistance levels: 17.85, 17.94, 18.00, 18.05.
Trading tips
Long positions can be opened at the current price with the targets at 18.20, 18.35 and stop loss at 17.70. Implementation period: 1-2 days.
Short positions can be opened at the level of 17.75 with the targets at 17.35, 17.15 and stop loss at 17.95. Implementation period: 1-2 days.


No comments:
Write comments