
NZD/USD: the pair is falling
07 September 2017, 10:00
| Scenario | |
|---|---|
| Timeframe | Intraday |
| Recommendation | BUY STOP |
| Entry Point | 0.7225 |
| Take Profit | 0.7297 |
| Stop Loss | 0.7160 |
| Key Levels | 0.7130, 0.7160, 0.7190, 0.7222, 0.7262, 0.7297, 0.7335 |
| Alternative scenario | |
|---|---|
| Recommendation | SELL STOP |
| Entry Point | 0.7180 |
| Take Profit | 0.7130, 0.7100 |
| Stop Loss | 0.7230 |
| Key Levels | 0.7130, 0.7160, 0.7190, 0.7222, 0.7262, 0.7297, 0.7335 |
Current trend
New Zealand dollar reduced as a result of trading on Wednesday, September 6, moving away from local maximums updated yesterday. There were no considerable reasons for the growth of the US currency on Wednesday, therefore the dynamics was mainly determined by technical factors.
On Wednesday, September 6, investors continued to monitor the release of macroeconomic statistics from the USA. ISM services PMI grew from 53.9 to 55.3 points which was worse than expected by analysts (55.8). Similar index by Markit dropped from 56.9 to 56.0 points against the forecast of 56.8 points.
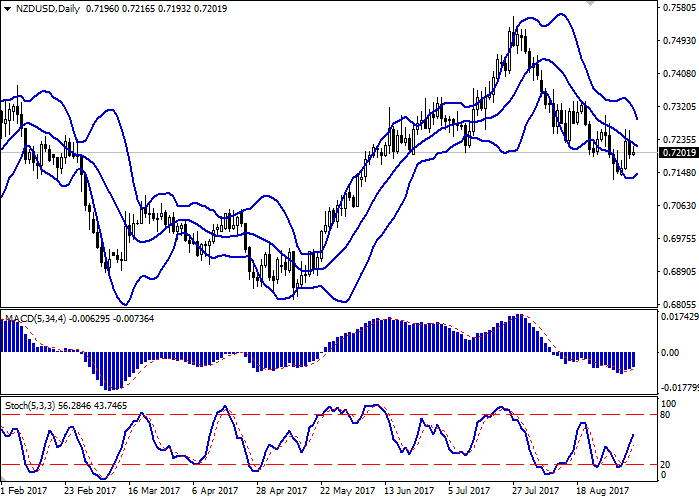
Support and resistance
Bollinger Bands on D1 chart demonstrate decrease. The price range is actively narrowing. MACD indicator is growing preserving a stable buy signal (the histogram is above the signal line). Stochastic is demonstrating similar dynamics trying to reach the border with the overbought area in the end of the current week.
Resistance levels: 0.7222, 0.7262, 0.7297, 0.7335.
Support levels: 0.7190, 0.7160, 0.7130.
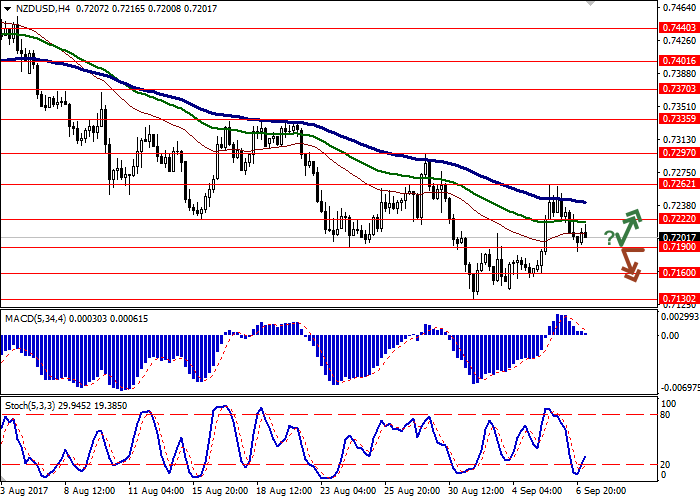
Trading tips
Long positions may be opened after breaking through the level of 0.7222 with target at 0.7297 and stop-loss at 0.7160, 0.7150. The period of implementation is 2-3 days.
Breaking down the level of 0.7190 may be a signal to opening short positions with targets at 0.7130, 0.7100 and stop-loss at 0.7230. The period of implementation is 2-3 days.
New Zealand dollar reduced as a result of trading on Wednesday, September 6, moving away from local maximums updated yesterday. There were no considerable reasons for the growth of the US currency on Wednesday, therefore the dynamics was mainly determined by technical factors.
On Wednesday, September 6, investors continued to monitor the release of macroeconomic statistics from the USA. ISM services PMI grew from 53.9 to 55.3 points which was worse than expected by analysts (55.8). Similar index by Markit dropped from 56.9 to 56.0 points against the forecast of 56.8 points.
Support and resistance
Bollinger Bands on D1 chart demonstrate decrease. The price range is actively narrowing. MACD indicator is growing preserving a stable buy signal (the histogram is above the signal line). Stochastic is demonstrating similar dynamics trying to reach the border with the overbought area in the end of the current week.
Resistance levels: 0.7222, 0.7262, 0.7297, 0.7335.
Support levels: 0.7190, 0.7160, 0.7130.
Trading tips
Long positions may be opened after breaking through the level of 0.7222 with target at 0.7297 and stop-loss at 0.7160, 0.7150. The period of implementation is 2-3 days.
Breaking down the level of 0.7190 may be a signal to opening short positions with targets at 0.7130, 0.7100 and stop-loss at 0.7230. The period of implementation is 2-3 days.


No comments:
Write comments