
FDAX: technical analysis
07 September 2017, 10:17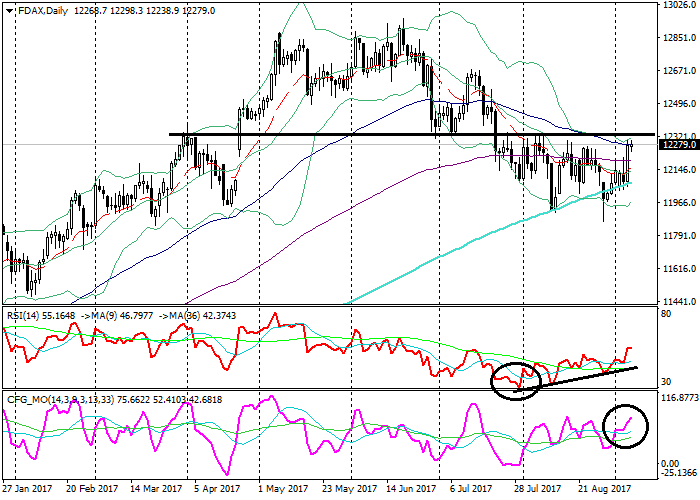
| Scenario | |
|---|---|
| Timeframe | Weekly |
| Recommendation | BUY STOP |
| Entry Point | 12335.0 |
| Take Profit | 12460.0, 12525.0 |
| Stop Loss | 12291.0 |
| Key Levels | 11947.0, 11980.0, 12075.0, 12335.0, 12460.0, 12525.0 |
| Alternative scenario | |
|---|---|
| Recommendation | SELL STOP |
| Entry Point | 12075.0 |
| Take Profit | 11980.0, 11947.0 |
| Stop Loss | 12130.0 |
| Key Levels | 11947.0, 11980.0, 12075.0, 12335.0, 12460.0, 12525.0 |
FDAX, D1
On the daily chart, the instrument is trading just below the upper line of the Bollinger Bands. The price remains on the level with its moving averages that turned horizontally. The RSI is growing as it yet failed to enter the oversold zone. The Composite is growing as well.

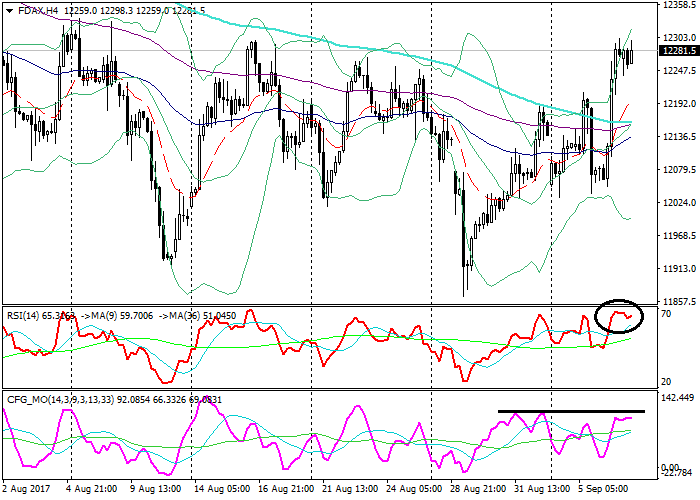
FDAX, H4
On the 4-hour chart, the instrument is trading just below the upper line of the Bollinger Bands. The price remains above its moving averages that are turning up. The RSI is approaching the border of the overbought zone. The Composite is about to test its strong resistance.
Key levels
Support levels: 12075.0 (July lows), 11980.0 (local lows), 11947.0 (April lows).
Resistance levels: 12335.0 (August highs), 12460.0 (April highs), 12525.0 (May lows).
Trading tips
The price is testing a strong resistance level near 12335.0. Its breakout would lead to a growth continuation.
Long positions can be opened from the level of 12335.0 with targets at 12460.0, 12525.0 and stop-loss at 12291.0. Validity – 3-5 days.
Short positions can be opened form the level of 12075.0 with targets at 11980.0, 11947.0 and stop-loss at 12130.0. Validity – 3-5 days.
On the daily chart, the instrument is trading just below the upper line of the Bollinger Bands. The price remains on the level with its moving averages that turned horizontally. The RSI is growing as it yet failed to enter the oversold zone. The Composite is growing as well.
FDAX, H4
On the 4-hour chart, the instrument is trading just below the upper line of the Bollinger Bands. The price remains above its moving averages that are turning up. The RSI is approaching the border of the overbought zone. The Composite is about to test its strong resistance.
Key levels
Support levels: 12075.0 (July lows), 11980.0 (local lows), 11947.0 (April lows).
Resistance levels: 12335.0 (August highs), 12460.0 (April highs), 12525.0 (May lows).
Trading tips
The price is testing a strong resistance level near 12335.0. Its breakout would lead to a growth continuation.
Long positions can be opened from the level of 12335.0 with targets at 12460.0, 12525.0 and stop-loss at 12291.0. Validity – 3-5 days.
Short positions can be opened form the level of 12075.0 with targets at 11980.0, 11947.0 and stop-loss at 12130.0. Validity – 3-5 days.


No comments:
Write comments