AddToAny

AddToAny

Theme images by MichaelJay. Powered by Blogger.

USD/JPY: the epidemiological situation in Japan is rapidly deteriorating 28 July 2022, 11:47

  USD/JPY: the epidemiological situation in Japan is rapidly deteriorating 28 July 2022, 11:47 Scenario Timeframe Weekly Reco...

Best Fx Strategy
Trade Forex On The Next Level ..

No Loss Trading Strategy


I am only an email away -

Message me...

Free Forex Daily Signals On All Major Pairs

FREE FX TRADING SIGNALS
Our Recent Fx Trading Signals Posted Daily

Jul 28, 2022

USD/JPY: the epidemiological situation in Japan is rapidly deteriorating 28 July 2022, 11:47


Scenario
Timeframe Weekly
Recommendation SELL STOP
Entry Point 134.74
Take Profit 132.16
Stop Loss 135.50
Key Levels 132.16, 134.74, 136.86, 139.34
Alternative scenario
Recommendation BUY STOP
Entry Point 136.86
Take Profit 139.34
Stop Loss 136.00
Key Levels 132.16, 134.74, 136.86, 139.34

Current trend

The yen continues to strengthen against the US dollar due to the outcome of the US Federal Reserve's monetary policy meeting held yesterday, as well as ongoing interventions from the Bank of Japan. At the moment, the trading instrument is around ​​135.49.

According to the World Health Organization, Japan has come out on top in the world in terms of the daily increase in the incidence of coronavirus. More than 200.0K cases of infection were registered yesterday, which has already become the reason for limiting the work of several large industries. The country is fighting the seventh wave of the pandemic. The country's southernmost prefecture, Okinawa, has been hardest hit by the new outbreak, according to authorities, but Tokyo, Osaka, and Hokkaido prefectures in the far north are also on the rise. However, the government does not intend to introduce strict quarantine restrictions soon, citing low mortality and urging the population to get vaccinated. Macroeconomic indicators also show negative dynamics, with the leading indicators index down 1.7% after rising 2.1% in June, and foreign investment in Japanese stocks fell to 298.1B yen this week from 475.0B yen earlier.

As for the US dollar, yesterday, the US Federal Reserve, as part of a meeting on monetary policy, raised the interest rate by 75 basis points. Several experts believe this will not be enough to reduce the rapid pace of inflation, as consumer prices in the country exceeded 9.0%, and the labor market began to decline. Probably, the American financial authorities fear a recession in the economy more than high inflation. However, a recession is already noted, and today's report on the dynamics of gross domestic product for the second quarter will most likely confirm this. Consequently, the regulator did not solve any of the current economic problems, only exacerbating the situation, which created additional pressure on the US dollar, the exchange rate of which the agency is actively trying to strengthen.

Support and resistance

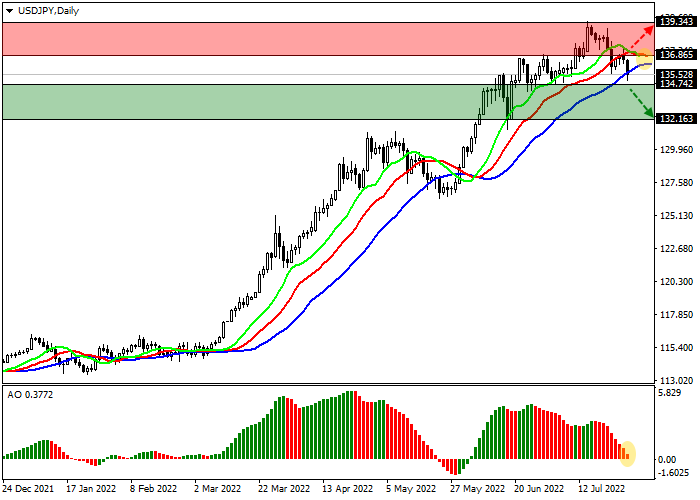
The trading instrument is within the global uptrend, declining to the support line. Technical indicators keep a buy signal, which is actively weakening: indicator Alligator's EMA oscillation range narrows and the AO oscillator histogram forms new downward bars, approaching the transition level.

Support levels: 134.74, 132.16.

Resistance levels: 136.86, 139.34.
Trading tips

Short positions may be opened after the continuation of the corrective decline in the asset or consolidation below 134.74 with the target at 132.16. Stop loss – 135.50. Implementation period: 7 days or more.

Long positions may be opened after the continued global growth of the asset or consolidation above the resistance level of 136.86 with the target at 139.34. Stop loss – 136.00.
USD/CHF: wave analysis 28 July 2022, 11:46


Scenario
Timeframe Weekly
Recommendation BUY
Entry Point 0.9582
Take Profit 1.0200, 1.0350
Stop Loss 0.9490
Key Levels 0.9186, 0.9319, 0.9490, 1.0200, 1.0350
Alternative scenario
Recommendation SELL STOP
Entry Point 0.9485
Take Profit 0.9319, 0.9186
Stop Loss 0.9545
Key Levels 0.9186, 0.9319, 0.9490, 1.0200, 1.0350

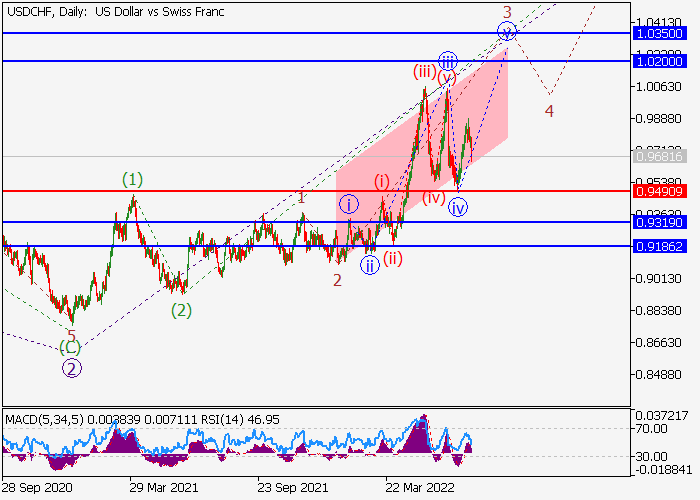
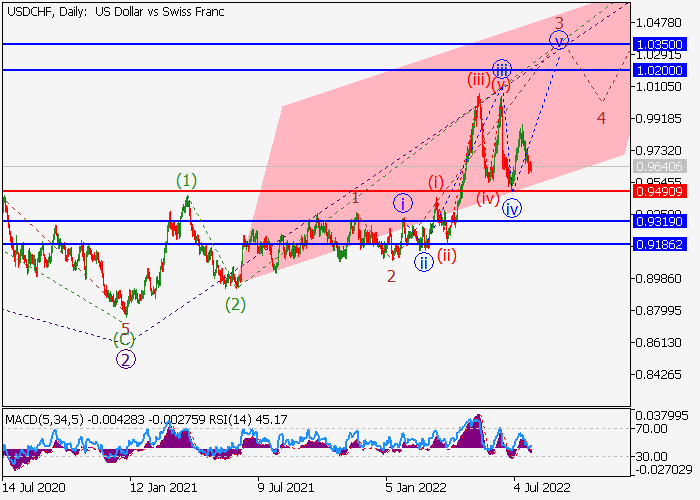
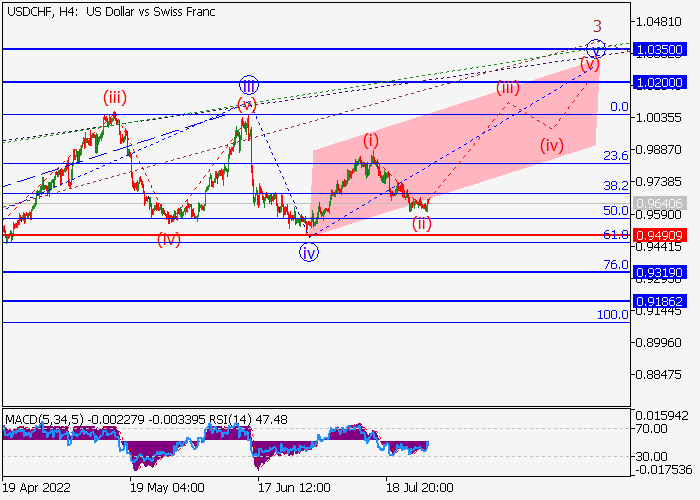
Growth is possible.

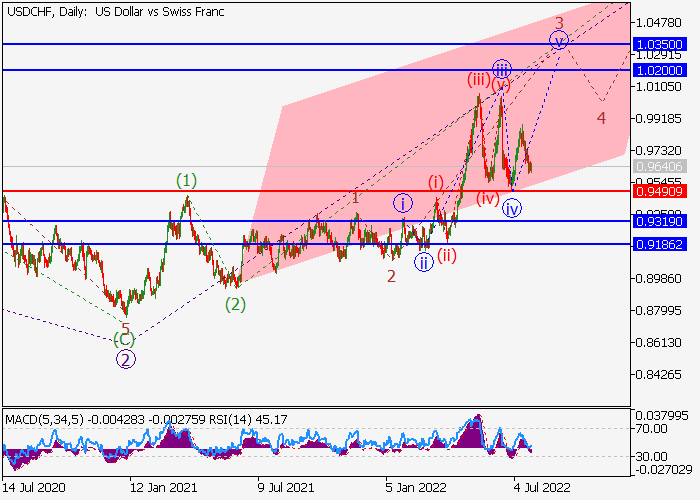
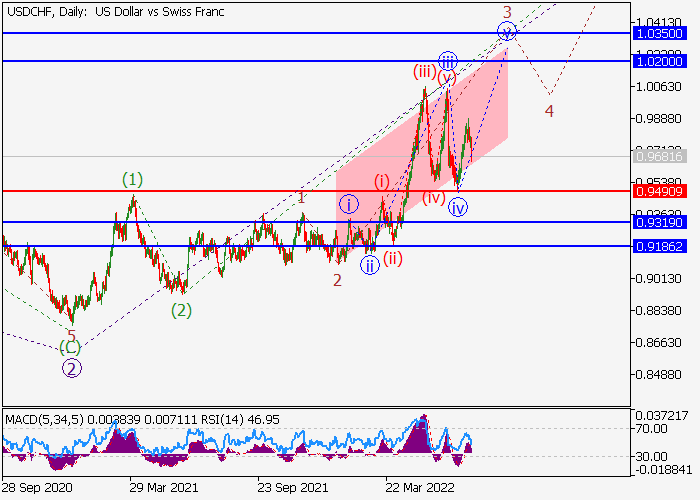
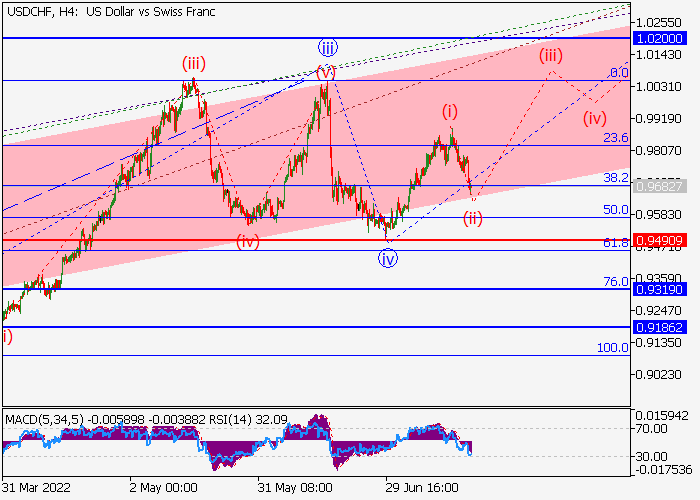
On the daily chart, the third wave of the higher level 3 of (3) develops, within which the wave iii of 3 formed, and a correction ended as the fourth wave iv of 3. Now, the fifth wave v of 3 is developing, within which the first wave of the lower level (i) of v has appeared, and a local correction has ended as the wave (ii) of v. If the assumption is correct, the USD/CHF pair will grow to the area of 1.0200–1.0350. In this scenario, critical stop loss level is 0.9490.

Main scenario

Long positions will become relevant after the end of the correction, above the level of 0.9490 with the targets at 1.0200–1.0350. Implementation period: 7 days and more.

Alternative scenario

The breakdown and the consolidation of the price below the level of 0.9490 will let the asset go down to the levels of 0.9319–0.9186.


AUD/USD: technical analysis 28 July 2022, 11:45


Scenario
Timeframe Weekly
Recommendation BUY STOP
Entry Point 0.7040
Take Profit 0.7191, 0.7397
Stop Loss 0.6987
Key Levels 0.6437, 0.6686, 0.6860, 0.7037, 0.7191, 0.7397
Alternative scenario
Recommendation SELL STOP
Entry Point 0.6855
Take Profit 0.6686, 0.6437
Stop Loss 0.6910
Key Levels 0.6437, 0.6686, 0.6860, 0.7037, 0.7191, 0.7397

AUD/USD, H4

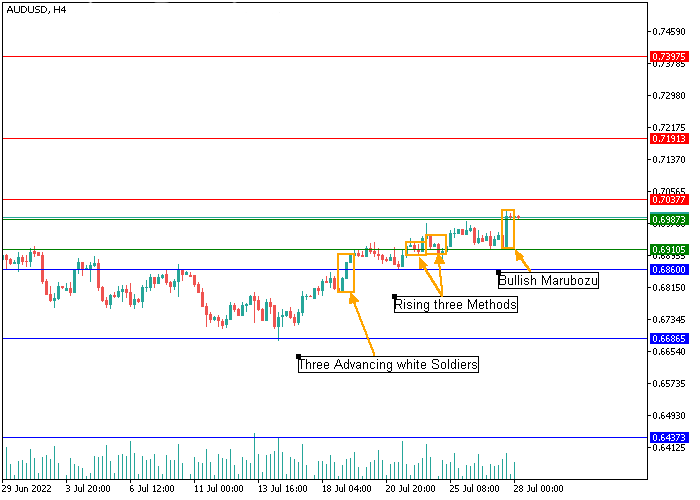
On the four-hour chart, at 0.6860, there is the formation of the Three advancing white soldiers pattern, meaning buyers have seized the initiative and intend to restore positions. In turn, the appearance of the Three “bullish” steps pattern also signals the continuation of the upward dynamics, and the “bullish” Marubozu pattern indicates the predominance of “bullish” sentiment. In the current situation, the asset will most likely continue to recover to the resistance level of 0.7037, which will allow the quotes to head to the zone of 0.7191−0.7397. An alternative scenario is possible after the consolidation below the support level of 0.6860, and then the downward movement may intensify to 0.6437.

AUD/USD, D1

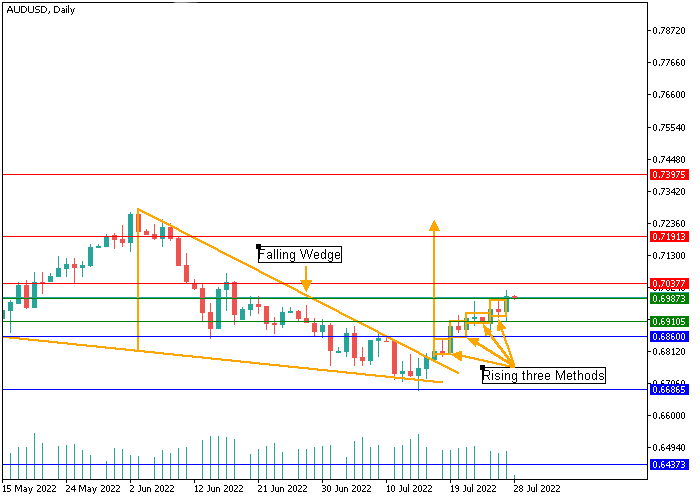
On the daily chart, a Falling wedge price pattern is being formed, from which the asset managed to break up, but its implementation has not yet been completed. The “bullish” mood for the instrument is also confirmed by a series of formed Three “bullish” steps figures, which serve as signals for the continuation of the uptrend. Most likely, the trading instrument will strengthen the upward dynamics to 0.7037, consolidation above which will become a catalyst for the movement of quotations to the area of ​​0.7191−0.7397.

Support and resistance

Support levels: 0.6860, 0.6686, 0.6437.

Resistance levels: 0.7037, 0.7191, 0.7397.

Trading tips

Long positions may be opened above 0.7037 with the targets at 0.7191, 0.7397. Stop loss – 0.6987. Implementation period: 7–9 days.

Short positions may be opened below 0.6860 with the targets at 0.6686, 0.6437. Stop loss – 0.6910.

USD/CAD: wave analysis 28 July 2022, 11:44


Scenario
Timeframe Weekly
Recommendation BUY
Entry Point 1.2829
Take Profit 1.3410, 1.3700
Stop Loss 1.2521
Key Levels 1.2010, 1.2280, 1.2521, 1.3410, 1.3700
Alternative scenario
Recommendation SELL STOP
Entry Point 1.2520
Take Profit 1.2280, 1.2010
Stop Loss 1.2600
Key Levels 1.2010, 1.2280, 1.2521, 1.3410, 1.3700

Growth is possible.

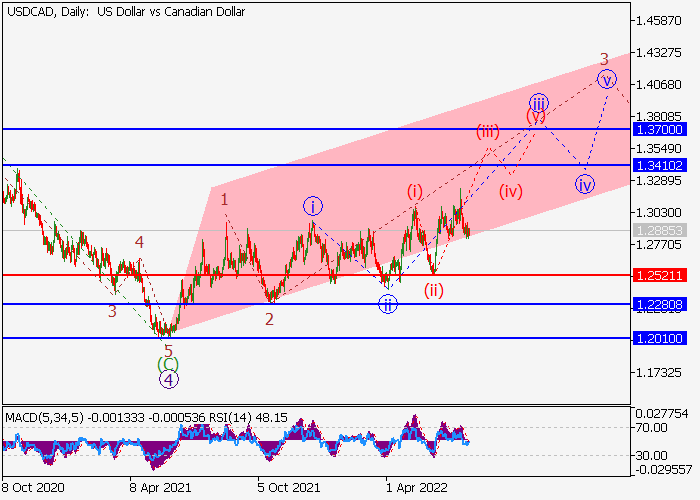
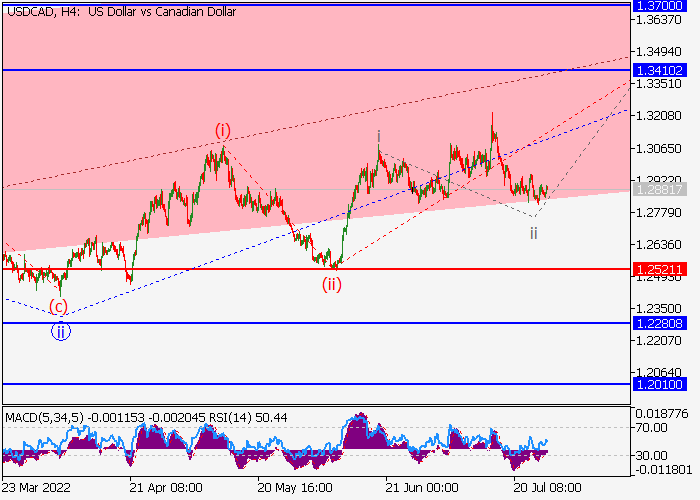
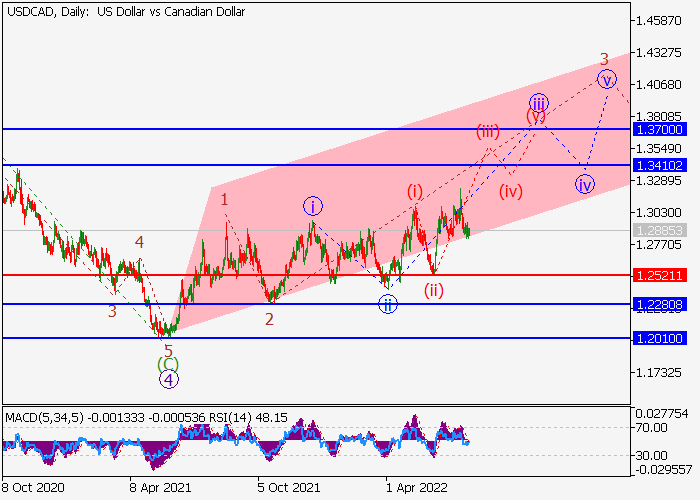
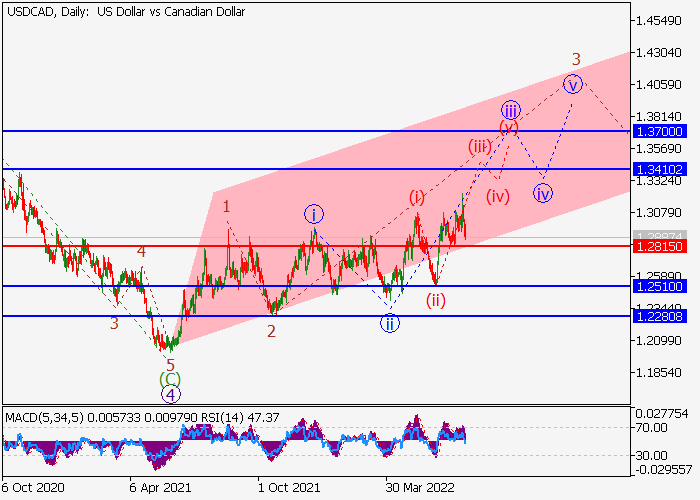
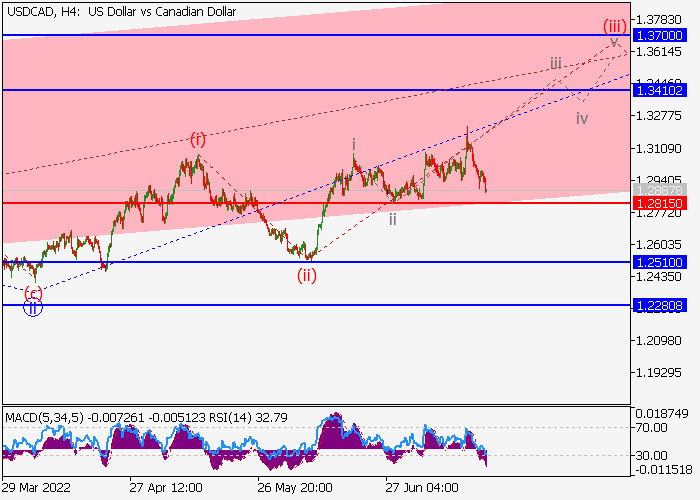
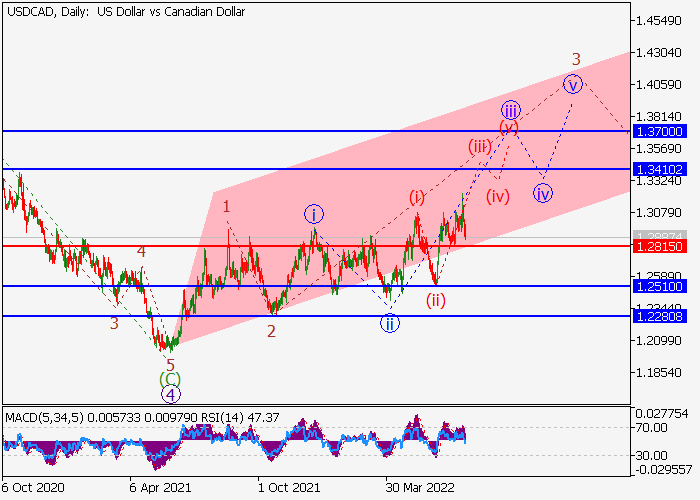
On the daily chart, the first wave of the higher level (1) of 5 forms, within which the wave 3 of (1) develops. Now, the third wave of the lower level iii of 3 is developing, within which the wave (iii) of iii is appearing. If the assumption is correct, the USD/CAD pair will grow to the area of 1.3410–1.3700. In this scenario, critical stop loss level is 1.2521.

Main scenario

Long positions will become relevant during the correction, above the level of 1.2521 with the targets at 1.3410–1.3700. Implementation period: 7 days and more.

Alternative scenario

The breakdown and the consolidation of the price below the level of 1.2521 will let the asset go down to the levels of 1.2280–1.2010.

EUR/USD: the decision of the US Federal Reserve disappointed investors 28 July 2022, 11:42


Scenario
Timeframe Weekly
Recommendation BUY STOP
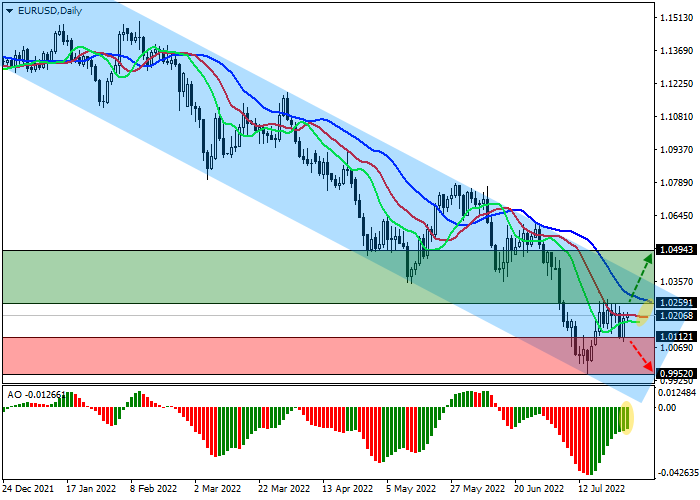
Entry Point 1.0259
Take Profit 1.0494
Stop Loss 1.0200
Key Levels 0.9952, 1.0112, 1.0259, 1.0494
Alternative scenario
Recommendation SELL STOP
Entry Point 1.0112
Take Profit 0.9952
Stop Loss 1.0220
Key Levels 0.9952, 1.0112, 1.0259, 1.0494

Current trend

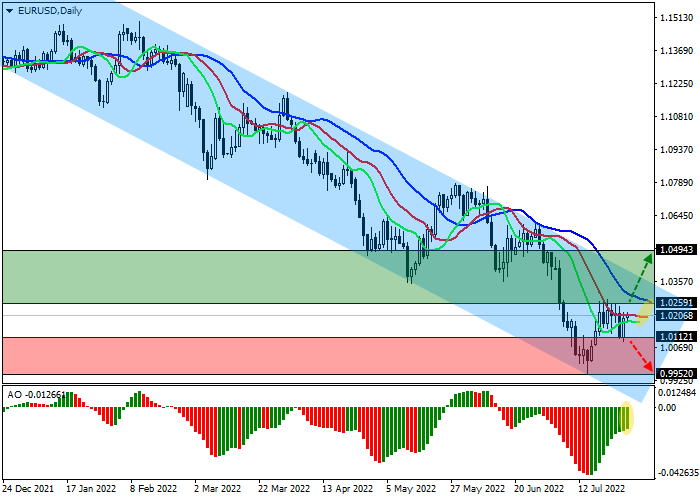
The EUR/USD pair is in a corrective trend, trading around 1.0205.

This week, within the framework of an extraordinary meeting, the energy ministers of the EU countries reached a compromise on the issue of reducing the consumption of "blue fuel" by 15% from the average level over the past five years. The emergency plan, developed in the event of a complete cessation of energy supplies from Russia, assumes a decrease in the volume of gas used in the upcoming winter heating season, starting from August this year to the end of March 2023. The driver for the decision was the reduction in the volume of fuel transported through the Nord Stream gas pipeline to 1/5 of the throughput capacity due to technical work carried out on the gas turbine engine. The market took this as a signal of an escalation of political tension between Russia and the European Union. Nevertheless, despite the decrease in the volume of supplies, the filling of gas storage facilities continues and, according to experts, may reach 80% by November 1. As for the state of the economies of the EU countries, the situation continues to deteriorate, and, as shown by the German consumer climate index for August, the decline in the indicator increased to –30.6 points, which is the absolute minimum in the history of observations.

The quotes of the American dollar came close to 106.000 in the USD Index. Investors are disappointed by the decision of the US Federal Reserve to raise interest rates by only 75 basis points, bringing them to 2.50%. As experts predicted yesterday, this level of adjustment is not enough to compensate for high inflation rates, and, against this background, the consumer price index may exceed 10% by the end of the year. The relatively "dovish" rhetoric of the regulator has further aggravated the situation in the economy since now the risks of the national economy going into recession are significantly increasing.

Support and resistance

The trading instrument moves within the global downward channel, rising towards the resistance line. Technical indicators hold a sell signal, which is weakening: fast EMAs on the Alligator indicator is approaching the signal line, and the AO oscillator histogram continues to form upward bars.

Support levels: 1.0112, 0.9952.

Resistance levels: 1.0259, 1.0494.

Trading tips

Long positions may be opened after the continuation of the corrective growth of the asset or consolidation above the local resistance level of 1.0259 with the target at 1.0494. Stop loss – 1.0200. Implementation period: 7 days or more.

Short positions may be opened after a reversal and continuation of the global decline in the asset and consolidation below the local support level of 1.0112 with the target at 0.9952. Stop loss – 1.0220.

XAU/USD: investors turn to gold in anticipation of a US recession 28 July 2022, 11:40


Scenario
Timeframe Weekly
Recommendation BUY STOP
Entry Point 1752.0
Take Profit 1807.0
Stop Loss 1720.0
Key Levels 1681.0, 1717.0, 1752.0, 1808.0
Alternative scenario
Recommendation SELL STOP
Entry Point 1717.0
Take Profit 1681.0
Stop Loss 1730.0
Key Levels 1681.0, 1717.0, 1752.0, 1808.0

Current trend

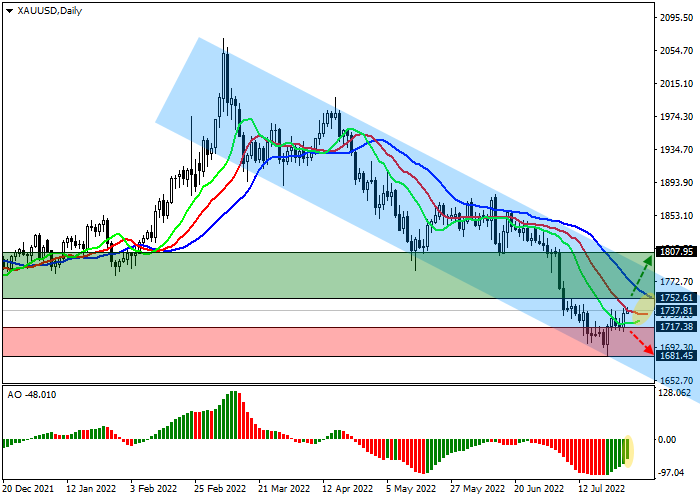
The quotes of the XAU/USD pair reversed at the solid multi-year support around 1700.0 and began to grow. The trading instrument is correcting within an uptrend of around 1,738K dollars per ounce.

Investors continue to monitor the economic situation in the US. Today, data on Q2 GDP will be presented, and preliminary estimates of experts have recorded a resumption of positive dynamics, reaching a value of 0.5% after falling by 1.6% in the previous period. However, since the publication of statistics for the first quarter, US Federal Reserve officials raised the interest rate by 1.50%, and inflation accelerated from 7.0% to 9.1%, which is completely contrary to positive forecasts. Traders are focused on the comments of US Treasury Secretary Janet Yellen, who will make a speech immediately after the release. Earlier, the official stated the need to reduce inflation, considering preserving a strong economy. While a recession is becoming inevitable, she says there are no signs of a downturn.

Meanwhile, traders are more actively redirecting their capital to the assets of the metal group, which traditionally act as a risk hedging instrument. The growth in the attractiveness of gold is confirmed by data on a sharp reduction in short positions to the highest value in the last five years – 20.180. At the same time, the buyers' positions for the last week increased by 2.832 contracts.

Support and resistance

On the daily chart, the formation of a wide downwards channel with dynamic boundaries 1800.0–1650.0 continues, and now the price is growing towards the resistance line. Technical indicators weaken the sell signal: fast EMAs on the Alligator indicator are actively approaching the signal line, and the AO oscillator histogram, being in the sell zone, is forming new rising bars.

Support levels: 1717.0, 1681.0.

Resistance levels: 1752.0, 1808.0.

Trading tips

Long positions may be opened after the continuation of the local growth of the asset or consolidation above the resistance level of 1752.0 with the target at 1807.0. Stop loss – 1720.0. Implementation period: 7 days or more.

Short positions may be opened after a reversal and continued decline in the asset or consolidation below the local support level of 1717.0 with the target at 1681.0. Stop loss – 1730.0.

Jul 20, 2022

USD/CAD: wave analysis 20 July 2022, 10:53


Scenario
Timeframe Weekly
Recommendation BUY
Entry Point 1.2862
Take Profit 1.3410, 1.3700
Stop Loss 1.2815
Key Levels 1.2280, 1.2510, 1.3410, 1.3700
Alternative scenario
Recommendation SELL STOP
Entry Point 1.2810
Take Profit 1.2510, 1.2280
Stop Loss 1.2910
Key Levels 1.2280, 1.2510, 1.3410, 1.3700

The pair may grow.

On the daily chart, the first wave of the higher level (1) of 5 is formed, within which the wave 3 of (1) develops. At the moment, the formation of the third wave of the lower level iii of 3 continues, in which wave (i) of iii has already appeared, the local correction as wave (ii) of iii has ended and the formation of wave (iii) of iii continues. If the assumption is correct, USD/CAD will rise to the levels of 1.3410–1.3700. The level of 1.2815 is critical and stop-loss for this scenario.

Main scenario

Long positions are relevant from the corrections above the level of 1.2815 with targets at 1.3410–1.3700. Implementation time: 7 days and more.

Alternative scenario

Breakdown and consolidation of the price below the level of 1.2815 will allow the trading instrument to continue its downtrend to the levels of 1.2510–1.2280.


USD/CHF: wave analysis 20 July 2022, 10:52


Scenario
Timeframe Weekly
Recommendation BUY
Entry Point 0.9685
Take Profit 1.0200, 1.0350
Stop Loss 0.9490
Key Levels 0.9186, 0.9319, 0.9490, 1.0200, 1.0350
Alternative scenario
Recommendation SELL STOP
Entry Point 0.9485
Take Profit 0.9319, 0.9186
Stop Loss 0.9545
Key Levels 0.9186, 0.9319, 0.9490, 1.0200, 1.0350

The possibility of growth remains.

On the daily chart, the development of the third wave of the higher level 3 of (3) continues, in which wave iii of 3 formed and the correction ended as the fourth wave iv of 3. At the moment, the construction of the fifth wave v of 3 is underway, in which the first wave of the lower level (i) of v has already appeared, and the development of a local correction as a wave (ii) of v is also being completed. If the assumption is correct, USD/CHF will rise to the levels of 1.0200–1.0350. The level of 0.9490 is critical and stop-loss for this scenario.

Main scenario

Long positions are relevant from the corrections above level of 0.9490 with targets at 1.0200–1.0350. Implementation time: 7 days and more.

Alternative scenario

Breakdown and consolidation of the price below the level of 0.9490 will allow the trading instrument to continue its downtrend to the levels of 0.9319–0.9186.


Best Binary Options Signals Service Providers


Binary Options Pro Signals
Top-Rated Signals for Binary Options

Up to 88% per Trade Our winning binary options signals will generate up to 88% profit PER TRADE. Stocks and Currencies We monitor 14 assets through London and US Market Sessions. SMS, Email and Web Signals will be sent to you Real Time via SMS/Text, Email or both!

Binary Options Pro Signals Click here...
Binary Trading Signals Live!
Join now and get LIVE, exclusive access to..

KILLER Binary Options and Forex Strategies We Use Daily INCREDIBLE In Depth Market Analysis On Multiple Assets QUALITY Trading Education and Discipline Training Binary Options Trading Signals Is The Premier Signal Service For Binary Options As You Watch A Live Trader With Over 10 Years Of Experience!

Binary Trading Signals Live Click here...
Quantum Binary Signals
Professional trading signals sent to your mobile.

Follow our trades today and make up to 270% a day. Real hedge funds traders with 20 years of experience, Up to 5 trades a day by email or SMS, Simple and takes only two minutes a day.. Binary options, forex, commodities, stocks and indices, 75-85% monthly success rate, No experience needed..

Quantum Binary Signals Click here...
Night Owl Signals
The most amazing thing is here..

Our service is astonishingly easy to use. Night Owl Signals Is A Live Trading Room Which Offers Traders A Unique Experience Following And Watching A Professional Trader Trade Live. The Service Starts At 8:30 Pm And Goes Until 10:00 Pm On Monday Through Thursday.

Night Owl Signals Click here...
No Loss Forex Trading Strategy
Click on Contact me.. >>>


If you are interested or have any questions - Contact us!